
Neuroimaging analysis, like sex, is a fun, exciting activity sometimes resulting in death. Although it is an enjoyable pastime for responsible adults, however, each year sees the arrival of ever-increasing numbers of inexperienced youngsters who also want to participate. Often their interest is piqued by irresponsible professors and academic rakehells extolling the pleasures of cortex, neurons, and brain science; other times, their imagination is aroused by lurid images in seedy neuroimaging journals depicting impossibly large brain activations - often, it should be added, achieved without using proper correction, correction which most researchers piously encourage in public but secretly admit dampens spontaneity and feels unnatural.
Read moreIntroduction to FreeSurfer, Part 1: Overview & Installation

Your Data Relationship
It’s normal to get bored. It’s normal to get frustrated. It’s normal to wake up one day next to your laptop, look at it, and not be able to imagine how you could spend another day analyzing fMRI data. It’s noisy, inconsiderate, and doesn’t care about your feelings. “Just give me a result!” you scream, pounding your fists against the screen. But it just sits there. Impassive.
Read moreROI Analysis Presentation
Overview
This post is a supplement to the ROI workshop at NYU. You can follow along with the lecture on YouTube here, and you can download the example dataset here.
Code Templates
The following code templates will be used for the workshop. You can change them to reflect the conditions and design of your own study. Also note that these code snippets can be rewritten to be used with loops.
- Creating an ROI: echo “42 -13 58” | 3dUndump -srad 5 -orient LPI -master subj001_stats.nii -prefix Right_M1.nii -xyz -
- Concatenating Contrast Maps: 3dTcat subj001_stats.nii'[3]' subj002_stats.nii'[3]', subj003_stats.nii'[3]' subj004_stats.nii'[3]' subj005_stats.nii'[3]' subj006_stats.nii'[3]' -prefix Left-Right_ContrastMaps.nii
- Extracting Data from an ROI: 3dROIstats -quiet -mask Right_M1.nii Left-Right_ContrastMaps.nii
Exercises for Unpacking Contrasts and Double Dissociations
- To unpack the contrast estimate of Left-Right button presses, we will need to extract the Left and Right contrast maps. These correspond to the volumes (or "sub-briks") 0 and 1 in each subject's dataset. In the 3dTcat code template above, replace the 3 with a 0 in order to concatenate the Left parameter estimates together, and change the output label after the -prefix option to reflect the new output dataset (e.g., Left.nii). Do the same procedure for the Right parameter estimates.
- Modify the 3dROIstats code template to extract the parameter estimates for Left and Right button presses from the Right_M1.nii mask.
- Create another ROI in the left motor cortex by flipping the sign of the X-coordinate in the 3dUndump code template (i.e., echo "-42 -13 58"). Change the prefix to Left_M1.nii. Then modify the 3dTcat and 3dROIstats code templates to extract Left and Right parameter estimates from the Left_M1 mask. Use your preferred statistical software package to test for significant differences between the parameters within each ROI, and test for an ROI x Condition interaction.
Additional Reading
Circular ROI Analysis: See the original Vul et al. 2009 paper, and the Kriegeskorte et al. 2009 paper.
Leave-One-Out-Cross-Validation (LOOCV): Esterman et al., 2010
How to use Neurosynth: See this webpage
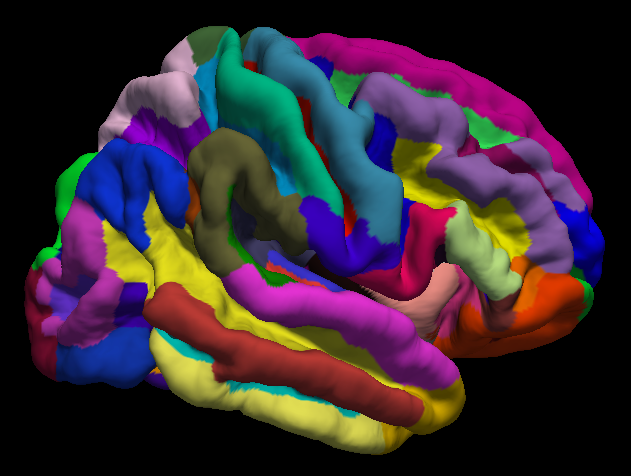
ROI Analyses in FreeSurfer
Note: This is a short post jotting down my thoughts on FreeSurfer ROI analysis. This will be developed into a longer post later; however, this is a topic I've been looking into for some time, and I want to keep track of my sources.
Regions of interest (ROIs) are groups of voxels that parameter estimates (or other data) are extracted from. With volumetric data, you specify the x-, y-, and z-coordinates of the origin for your ROI, and then build a sphere around it. (Spheres aren't the only method, but they are common.) You can do this with, for example: AFNI's 3dUndump; SPM's Marsbar toolbox; FSL's fslmaths.
I haven't been able to find out how to do a similar procedure with FreeSurfer. FS is 2D, so the ROI would probably be a circle instead of a sphere. Once your ROI is defined, then you could extract thickness, volume, and other measurements from the ROI.
See this post by Doug Greve about using a vertex as the base for an ROI: https://surfer.nmr.mgh.harvard.edu/fswiki/FsTutorial/QuestionAnswers
Also keep this:
#!/bin/tcsh
setenv SUBJECTS_DIR `pwd`
#Create 5mm sphere ROI with 3dUndump
3dUndump -srad 5 -prefix S2.nii -master MNI_caez*+tlrc.HEAD -orient LPI -xyz ROI_file.txt
#Convert to NIFTI
#3dAFNItoNIFTI S2+tlrc
#View in tkmedit
tkmedit -f MNI_caez_N27.nii -overlay S2.nii -fthresh 0.5
#Register anatomical template to fsaverage (FreeSurfer template)
fslregister --s fsaverage --mov MNI_caez_N27.nii --reg tmp.dat
#View ROI on fsaverage
tkmedit fsaverage T1.mgz -overlay S2.nii -overlay-reg tmp.dat -fthresh 0.5 -surface lh.white -aux-surface rh.white
#Map ROI to fsaverage surface
mri_vol2surf --mov S2.nii \
--reg tmp.dat \
--projdist-max 0 1 0.1 \
--interp nearest \
--hemi lh \
--out lh.fsaverage.S2.mgh \
--noreshape
#Check how well the ROI maps onto the inflated surface
tksurfer fsaverage lh inflated -overlay lh.fsaverage.S2.mgh -fthresh 0.5
If you want to extract data from an ROI label, use the mri_segstats option. For example, let's say that I have all of my subjects stacked together in a single dataset using the mris_preproc option, and I have the right hemisphere volume maps in a single dataset. If my ROI is called ROI.mgh, I would use this command:
mri_segstats --i ../../rh.volume.StudyName.10.mgh --seg ROI.mgh --excludeid 0 --avgwf ROI_results.dat
Which would print the average volume over the ROI into the file ROI_results.dat.
Best,
-Andy
FreeSurfer Workshop, Day #1: Overview and Installation
This post is for the FreeSurfer Workshop given at Haskins Laboratories on Wednesday, December 6th, at 3:00pm. Here you will find links to the programs that were discussed during the workshop. Workshop attendees can also post comments in the Disqus section below.
FreeSurfer Download:
FreeSurfer can be downloaded from this link: https://surfer.nmr.mgh.harvard.edu/fswiki/DownloadAndInstall
Prerequisites for installing parallel:
Apple Xcode: https://itunes.apple.com/us/app/xcode/id497799835?mt=12
Homebrew: https://brew.sh/
Follow the instructions on the Homebrew site for installation, then open a terminal and type "brew install parallel." Then go into your directory containing your anatomical images (in NIFTI format) and type the following:
ls *.nii | parallel --jobs 8 recon-all -s {.} -i {} -qcache -3T -all
You may want to set your SUBJECTS_DIR variable to your current working directory with the following command:
In t-shell: setenv SUBJECTS_DIR `pwd`
In bash: export SUBJETS_DIR=`pwd`
Open Science Grid
Join OSG by going here: https://www.opensciencegrid.org/join/
To deidentify fMRI data, convert your DICOM files with dcm2niix: https://github.com/rordenlab/dcm2niix
MRIs can be anonymized with mri_deface: https://surfer.nmr.mgh.harvard.edu/fswiki/mri_deface
Next, get fsurf, OSG's FreeSurfer command: https://support.opensciencegrid.org/support/solutions/articles/12000008488-setting-up-fsurf-on-your-computer
Downloading the sample data
Anatomical data from openfmri.org can be found here: https://openfmri.org/dataset/ds000174/
Running fsurf
Create a text file called "run_fsurf.sh" and use this text:
#!/bin/tcsh
#This script submits each zipped directory structure to fsurf
#You can check the status of the workflow by typing "fsurf list"
#First create the file "subjList.txt" by going into the ds174 directory containing all of the subject directories, and typing the following:
# ls | grep sub* > subjList.txt
foreach subj (`cat subjList.txt`)
cd $subj/ses-BL/anat
fsurf submit --subject=$subj --input=$subj.zip --defaced --deidentified --version 6.0.0 --freesurfer-options='-all -3T -qcache'
cd ../../..
end
As the file states, first create a textfile called "subjList.txt" by typing this from the terminal:
ls | grep sub* > subjList.txt
Then run the script using the t-shell:
tcsh run_fsurf.sh
You can check on your workflows on the OSG by typing "fsurf list"
FreeSurfer Tutorials on YouTube
This page will be updated with more links and videos; check back soon!
Introduction to FSLeyes: Playlist and Tutorials
FSLeyes interface in FEAT mode. 1) Statistics overlaid on functional data, showing the orthogonal x, y, and z views; 2) Significant clusters for that contrast, including buttons to jump to the peak voxel in the cluster; 3) Time series view, overlaying the full model fit on the data at that voxel, along with individual regressors.
Teaching fMRI analysis is a formidable task; one has to know some basic facts about statistics, image analysis, physiology, psychology, WW2 history, movie trivia, and a few pick-up lines to even get started. (The well-known line that uses "regions of interest" as a euphemism for erogenous zones has been quoted threadbare, but is still surprisingly effective.)
Read moreHigh-Pass Filtering and the Nyquist Frequency

Illustration of how sampling rate can generate a different waveform. Black: Original waveform; Red dots: Sampling of the original waveform. When a line (red) is interpolated among the sampled points of the original waveform, a waveform of a different frequency is generated.
Note: See Wiktor's comment below for a comparison of frequency cutoffs across AFNI, FSL, and SPM.
Yesterday I had the following conversation on one of my YouTube videos:
J: Thanks for the video. My question pertains the cut-off filtering frequency: When you apply a HP [High-Pass] filter in fMRI (typically it's .008 Hz), is this at the Nyquist frequency? Meaning that .008/2 is the actual frequency we are removing? Thank you.
Read moreE-Prime Tutorial #11: Making Your Experiment Scanner-Compatible
This tutorial uses many of the concepts you've learned so far about E-Prime: Objects, attributes, E-Basic code, and more. It is a summary of everything we've done in the previous tutorials and also applies your learning to something you may do for your research: Creating a scanner-compatible E-Prime experiment.
Read moreE-Prime Tutorial #10: E-Merge and E-DataAid
When an E-Prime experiment terminates without any errors, E-Prime generates data files called edat files. An edat file is created each time the experiment terminates, and each edat file is labeled with the experiment name, subject number, and session number. These files contain the value of each attribute for each trial and log them into a spreadsheet. Depending on how you set up your experiment there can be one or several edat files per subject.
Read moreCan you use AFNI's 3dFWHMx with SPM's residual data?
The following was a conversation on the message boards of my old blog, and I thought it might be interesting to those of you using AFNI tools on SPM data. As I mention below, I'm not sure whether the following approach works, but it seemed reasonable. If anyone else has any thoughts, I'd like to hear them in the comments section below!
Read more