Mumford & Stats: Up Your Neuroscience Game


Jeanette Mumford, furious at the lack of accessible tutorials on neuroimaging statistics, has created her own Tumblr to distribute her knowledge to the masses.

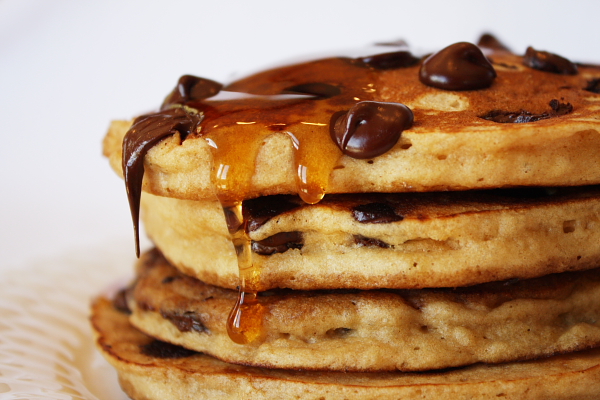
I find examples like these heartening; researchers and statisticians providing help to newcomers and veterans of all stripes. Listservs, while useful, often suffer from poorly worded questions, opaque responses, and overspecificity - the issues are individual, and so are the answers, which go together like highly specific shapes of toast in a specialized toaster.* Tutorials like Mumford's are more like pancake batter spread out over a griddle, covering a wide area and seeping into the drip pans of understanding, while being sprinkled with chocolate chips of insight, lightly buttered with good humor, and drizzled with the maple syrup of kindness.

I also find tutorials like these useful because - let's admit it - we're all slightly stupid when it comes to statistics. Have you ever tried explaining it to your dad, and ended up feeling like a fool? Clearly, we need all the help we can get. If you've ever had to doublecheck why, for example, a t-test works the way it does, or brush up on how contrast weights are made, this website is for you. (People who never had to suffer to understand statistics, on the other hand, just like people who don't have any problems writing, are disgusting and should be avoided.)

Jeanette has thirty-two videos covering the basics of statistics and their application to neuroimaging data, a compression of one of her semester-long fMRI data courses which should be required viewing for any neophyte. More recent postings report on developments and concerns in neuroimaging methods, such as collinearity, orthogonalization, nonparametric thresholding, and whether you should date fellow graduate students in your cohort. (I actually haven't read all of the posts that closely, but I'm assuming that something that important is probably in there somewhere.) And, unlike myself, she doesn't make false promises and she posts regularly; you get to stay current on what's hot, what's not, and, possibly, you can begin to make sense of those knotty methods sections. At least you'll begin to make some sense of the gibberish your advisor mutters in your general direction the next time he wants you to do a new analysis on the default pancake network - the network of regions that is activated in response to a contrast of pancakes versus waffles, since they are matched on everything but texture.**

It is efforts such as this that make the universe of neuroimaging, if not less complex, at least more comprehensible, less bewildering; more approachable, less terrifying. And any effort like that deserves its due measure of praise and pancakes.


*It was only after writing this that I realized you put bread into a toaster - toast is what comes out - but I decided to just own it.

**Do not steal this study idea from me.

Converting T-Maps to Z-Maps

Mankind craves unity - the peace that comes with knowing that everyone thinks and feels the same. Religious, political, social endeavors have all been directed toward this same end; that all men have the same worldview, the same Weltanschauung. Petty squabbles about things such as guns and abortion matter little when compared to the aim of these architects. See, for example, the deep penetration into our bloodstream by words such as equality, lifestyle, value - words of tremendous import, triggering automatic and powerful reactions without our quite knowing why, and with only a dim awareness of where these words came from. That we use and respond to them constantly is one of the most astounding triumphs of modern times; that we could even judge whether this is a good or bad thing has already been rendered moot. Best not to try.

It is only fitting, therefore, that we as neuroimagers all "get on the same page" and learn "the right way to do things," and, when possible, make "air quotes." This is another way of saying that this blog is an undisguised attempt to dominate the thoughts and soul of every neuroimager - in short, to ensure unity. And I can think of no greater emblem of unity than the normal distribution, also known as the Z-distribution - the end, the omega, the seal of all distributions. The most vicious of arguments, the most controversial of ideas are quickly resolved by appeal to this monolith; it towers over all research questions like a baleful phallus.

There will be no end to bantering about whether to abolish the arbitrary nature of p less than 0.05, but the bantering will be just that. The standard exists for a reason - it is clear, simple, understood by nearly everyone involved, and is as good a standard as any. A multitude of standards, a deviation from what has become so steeped in tradition, would be chaos, mayhem, a catastrophe. Again, best not to try.

I wish to clear away your childish notions that the Z-distribution is unfair or silly. On the contrary, it will dominate your research life until the day you die. Best to get along with it. The following SPM code will allow you to do just that - convert any output to the normal distribution, so that your results can be understood by anyone. Even by those who disagree, or wish to disagree, with the nature of this thing, will be forced to accept it. A shared Weltanschauung is a powerful thing. The most powerful.


=============

The following Matlab snippet was created by my adviser, Josh Brown. I take no credit for it, but I use it frequently, and believe others will get some use out of it. The calculators in each of the major statistical packages - SPM, AFNI, FSL - all do the same thing, and this is merely one application of it. The more one gets used to applying these transformations to achieve a desired result, the more intuitive it becomes to work with the data at any stage - registration, normalization, statistics, all.


%
% Usage:  convert_spm_stat(conversion, infile, outfile, dof)
%
% This script uses a template .mat batch script object to
% convert an SPM (e.g. SPMT_0001.hdr,img) to a different statistical rep.
% (Requires matlab stats toolbox)
%
%  Args:
%  conversion -- one of 'TtoZ', 'ZtoT', '-log10PtoZ', 'Zto-log10P',
%               'PtoZ', 'ZtoP'
%  infile -- input file stem (may include full path)
%  outfile -- output file stem (may include full pasth)
%  dof -- degrees of freedom
%
% Created by:           Josh Brown 
% Modification date:    Aug. 3, 2007
% Modified: 8/21/2009 Adam Krawitz - Added '-log10PtoZ' and 'Zto-log10P'
% Modified: 2/10/2010 Adam Krawitz - Added 'PtoZ' and 'ZtoP'

function completed=convert_spm_stat(conversion, infile, outfile, dof)

old_dir = cd();

if strcmp(conversion,'TtoZ')
    expval = ['norminv(tcdf(i1,' num2str(dof) '),0,1)'];
elseif strcmp(conversion,'ZtoT')
    expval = ['tinv(normcdf(i1,0,1),' num2str(dof) ')'];
elseif strcmp(conversion,'-log10PtoZ')
    expval = 'norminv(1-10.^(-i1),0,1)';
elseif strcmp(conversion,'Zto-log10P')
    expval = '-log10(1-normcdf(i1,0,1))';
elseif strcmp(conversion,'PtoZ')
    expval = 'norminv(1-i1,0,1)';
elseif strcmp(conversion,'ZtoP')
    expval = '1-normcdf(i1,0,1)';
else
    disp(['Conversion "' conversion '" unrecognized']);
    return;
end
    
if isempty(outfile)
    outfile = [infile '_' conversion];
end

if strcmp(conversion,'ZtoT')
    expval = ['tinv(normcdf(i1,0,1),' num2str(dof) ')'];
elseif strcmp(conversion,'-log10PtoZ')
    expval = 'norminv(1-10.^(-i1),0,1)';
end

%%% Now load into template and run
jobs{1}.util{1}.imcalc.input{1}=[infile '.img,1'];
jobs{1}.util{1}.imcalc.output=[outfile '.img'];
jobs{1}.util{1}.imcalc.expression=expval;

% run it:
spm_jobman('run', jobs);

cd(old_dir)
disp(['Conversion ' conversion ' complete.']);
completed = 1;


Assuming you have a T-map generated by SPM, and 25 subjects that went into the analysis, a sample command might be:

convert_spm_stat('TtoZ', 'spmT_0001', 'spmZ_0001', '24')

Note that the last argument is degrees of freedom, or N-1.


Slice Analysis of FMRI Data with SPM


Slice analysis is a simple procedure - first you take a jar of peanut butter and a jar of Nutella, and then use a spoon to take some Nutella and then use the same spoon to mix it with the peanut butter. Eat and repeat until you go into insulin shock, and then...

No, wait! I was describing my midnight snack. The actual slice analysis method, although less delicious, is infinitely more helpful in determining regional dissociations of activity, as well as avoiding diabetes. (Although who says they can't both be done at the same time?)

The first step is to extract contrast estimates for each slice from a region of interest (ROI, also pronounced "ROY") and then average across all the voxels in that slice for the subject. Of course, there is no way you would be able to do this step on your own, so we need to copy someone else's code from the Internet and adapt it to our needs; one of John Ashburner's code snippets (#23, found here) is a good template to start with. Here is my adaptation:


rootdir = '/data/drill/space10/PainStudy/fmri/'; %Change these to reflect your directory structure
glmdir = '/RESULTS/model_RTreg/'; %Path to SPM.mat and mask files

subjects = [202:209 211:215 217 219 220:222 224:227 229 230 232 233];
%subjects = 202:203;

Conditions.names = {'stroopSurpriseConStats', 'painSurpriseConStats'}; %Replace with your own conditions
Masks = {'stroopSurpriseMask.img', 'painSurpriseMask.img'}; %Replace with your own masks; should be the product of a binary ROI multiplied by your contrast of interest
Conditions.Contrasts = {'', ''};

ConStats = [];
Condition1 = [];
Condition2 = [];

for i=subjects
    
    cd([rootdir num2str(i) glmdir])
    outputPath = [rootdir num2str(i) glmdir]; %Should contain both SPM.mat file and mask files
    
    for maskIdx = 1:length(Masks)
      
    P = [outputPath Masks{(maskIdx)}];

    V=spm_vol(P);

    tmp2 = [];
    
     [x,y,z] = ndgrid(1:V.dim(1),1:V.dim(2),0);
     for i=1:V.dim(3),
       z   = z + 1;
       tmp = spm_sample_vol(V,x,y,z,0);
       msk = find(tmp~=0 & isfinite(tmp));
       if ~isempty(msk),
         tmp = tmp(msk);
         xyz1=[x(msk)'; y(msk)'; z(msk)'; ones(1,length(msk))];
         xyzt=V.mat(1:3,:)*xyz1;
         for j=1:length(tmp),
           tmp2 = [tmp2; xyzt(1,j), xyzt(2,j), xyzt(3,j), tmp(j)];
         end;
       end;
     end;

         xyzStats = sortrows(tmp2,2); %Sort relative to second column (Y column); 1 = X, 3 = Z
         minY = min(xyzStats(:,2));
         maxY = max(xyzStats(:,2));

         ConStats = [];

     for idx = minY:2:maxY
         x = find(xyzStats(:,2)==idx); %Go in increments of 2, since most images are warped to this dimension; however, change if resolution is different
         ConStats = [ConStats; mean(xyzStats(min(x):max(x),4))];
     end

    if maskIdx == 1
        Condition1 = [ConStats Condition1];
    elseif maskIdx == 2
        Condition2 = [ConStats Condition2];
    end

    end
end

Conditions.Contrasts{1} = Condition1;
Conditions.Contrasts{2} = Condition2;


This script assumes that there are only two conditions; more can be added, but care should be taken to reflect this, especially with the if/else statement near the end of the script. I could refine it to work with any amount of conditions, but that would require effort and talent.

Once these contrasts are loaded into your structure, you can then put them in an Excel spreadsheet or any other program that will allow you to format and save the contrasts in a tab-delimited text format. The goal is to prepare them for analysis in R, where you can test for main effects and interactions across the ROI for your contrasts. In Excel, I like to format it in the following four-column format:


Subject Condition Position  Contrast
202 Stroop 0 -0.791985669
202 Stroop 2 -0.558366941
202 Stroop 4 -0.338829942
202 Pain 0 0.17158524
202 Pain 2 0.267789503
202 Pain 4 0.192473782
203 Stroop 0 0.596162455
203 Stroop 2 0.44917655
203 Stroop 4 0.410870348
203 Pain 0 0.722974284
203 Pain 2 0.871030304
203 Pain 4 1.045700207


And so on, depending on how many subjects, conditions, and slices you have. (Note here that I have position in millimeters from the origin in the y-direction; this will depend on your standardized space resolution, which in this case is 2mm per slice.)

Once you export that to a tab-delimited text file, you can then read it into R and analyze it with code like the following:

setwd("~/Desktop")
x = read.table("SliceAnalysis.txt", header=TRUE)
x$Subject <- as.factor="" font="" ubject="" x="">
aov.x = aov(Contrast~(Condition*Position)+Error(Subject/(Condition*Position)),x)
summary(aov.x)
interaction.plot(x$Position, x$Condition, x$Contrast)


This will output statistics for main effects and interactions, as well as plotting the contrasts against each other as a function of position.

That's it! Enjoy your slices, crack open some jars of sugary products, and have some wild times!


DTI Analysis: Soup to Nuts Playlist


Instead of going through each DTI analysis step individually, I've collated everything into a Youtube playlist down below. Just remember that we are using data from the FSL practical course here, and also remember that suing somebody for giving out bad advice, although it is admittedly an easy way to become fantastically wealthy, won't necessarily make you happier.

In any case, just to briefly go over the rest of the steps: After correcting for magnetic field distortions and eddy currents, tensors are fitted using the dtifit command (or simply going through the FDT menu in the FSL interface). Once this has been done for each subject, a series of TBSS tools are used, each one prefixed by "tbss"; for example, tbss_1_preproc, tbss_2_reg, and so on. (You can find all of these in the $FSLDIR/bin directory, and if you have a good handle on Unix programming, you can inspect the code yourself.) After you have run all of those for your dataset, you set up the appropriate experimental design and contrasts, and use the randomise tool to perform statistics in your tractography mask.

Keep in mind that this is just beginner's material; and that if you were to compare your DTI competence to dating, if would be like you were still in that awkward teenager phase, unable to talk to anybody or make eye contact.

However, much of this material has already been covered in other blogs and online resources, provided by several other highly talented scientists and researchers, and - as much as I constantly fantasize about establishing a monopoly over neuroimaging information - there is no practical way to destroy them all.

Therefore, instead of posting redundant information, I highly recommend checking out an ongoing step-by-step series on TORTOISE by Peter Molfese, which you can compare to your results with FSL, and another blog dedicated to diffusion imaging, diffusion-imaging.com. The latter site covers virtually every piece of diffusion imaging software and pipeline out there, and is a good place to start.


What Good is Neuroimaging?

If there is one absolute in this universe, it is that people want more stuff. Given the choice between stuff and nothing, people will choose stuff, nine times out of ten. Therefore, as science is a business as well as an intellectual pursuit, any scientist would be well-advised to take a step back once in a while and consider whether his work makes the public feel as though that they are getting more stuff. This gets back to the divide between basic research and translational research: basic research being done more for its own sake, and to just figure stuff out; and translational research, which attempts to bridge basic scientific findings and transform them into improved technologies or therapies.

A recent article in the Journal of Cognitive Neuroscience (Moran & Zaki, 2013) addresses these very issues, stating that neuroimaging has reached a critical mass of exploratory findings through brain mapping, but in order to advance will have to take a more theoretically rigorous approach. In the good old days, it was interesting to do basic exploratory analyses to examine the functional role of large chunks of cortical real estate, such as the visual cortex, auditory cortex, and some subcortical structures. However, the authors maintain that most new exploratory brain analyses - i.e., those that simply want to find out what brain region is responsive to a certain task or a certain stimulus - are rapidly entering the far end of diminishing returns. What is needed, rather, is experiments that can adjudicate between competing theories of brain function, using forward inference to distinguish between alternative hypotheses, instead of reverse inference, which reasons that because a particular region shows more activity than normal, then a particular process must be involved (cf. Poldrack, 2006).

However, even with reverse inference, some assumptions can be made about a cognitive state. For example, with large-scale databases such as Neurosynth, one can quickly see how many studies claim that a given region is involved in a particular cognitive process. This lends more credibility to reverse inference claims that dovetail with evidence from the majority of studies, as opposed to selecting a single study that claimed to have found evidence of a cognitive process associated with a certain area, as this may be more susceptible to a false positive.

For practical uses, however, neuroimaging - and FMRI in particular - has been able to make predictions about behavior based on brain activity. For example, in a growing body of decision-making research, increased activity in the anterior insula predicted better choices in a risky decision-making task (Krawitz et al, 2010), and within a group of smokers shown anti-tobacco ads, dorso-medial prefrontal cortex activity predicted levels of a nicotine metabolite at a later follow-up (Wang et al, 2013). This seems to be a profitable avenue of neuroimaging research, as neural activity can provide more information about effective treatment programs, from drug PSAs to psychological therapies, above and beyond behavioral measures.

In light of all this, the evidence suggests that, although brain mapping for its own sake will continue to be popular, the higher-impact work appears to be shifting more emphatically in the direction of translational research. The human desire for stuff will always trump the human desire of curiosity, and the researcher would be wise to pay heed to this, lest he be swallowed up in darkness.

CNS 2013 Review

Last weekend marked my second attendance of the Cognitive Neuroscience Society conference, and I had a terrific time, each night full of drinking, wenching, gaming, brawling, dancing, freethinking, casuistry, and innumerable other vices. I dined on the best seafood that San Francisco had to offer, devouring breadbowls of clam chowder and pots of carmelized catfish and platters of sushi. I witnessed fights between sea lions, observed the Golden Gate bridge expand and contract in proportion to its temperature, and toured the Ghiradelli chocolate factory complex. Having access to a television for the first time in months, I watched the last half of S.W.A.T. and the first half of Face/Off, which, taken together, made for a satisfying, full-length action movie.

However, I also managed to find the time to go to some talks and posters detailing the latest findings in my field. A few trends I noticed:

1. Development and aging are hot right now, particularly since a large segment of the population is approaching old age and beginning to experience the effects of dementia, senescence, and increased irritability at perceived injustices, such as when your children fail to call you when they say that they will. I saw several posters looking at cognitive control effects over time, and how different interventions affected measures of executive function; and since the baby boomers are funding a large part of this research, so the importance of this field will continue to grow in proportion to their collective terror in the face of aging and its associated infirmities, creeping maladies seen from a distance yet unstoppable, as a man bound to a stake in the middle of a desert might feel as he is approached by irate wildlife.

2. Cognitive strategies such as mindfulness meditation and reappraisal are also hot right now; and although they might seem a bit faddish, the evidence of their efficacy is compelling. Expect to see more of these and their ilk increasingly applied across a wider variety of pathologies, such as depression, chronic pain, tinnitus, and addiction.


Lastly, while supping at the Ghiradelli chocolate factory with a postdoc, he mentioned that he was miffed by the lack of theory-driven experiments in several of the posters he saw. That is to say, several posters would lead in with a statement such as "Much research has been done on topic X. However, relatively little is known about Y...", with an experiment devoted to the effects of Y. In my colleague's opinion, this leads to a broadening of the field without refining or testing any of the existing theories. Indeed, if any think his fears to be unfounded, here I reprint an abstract seen at the conference which would appear to support his apprehensions about unfocused research endeavors:


Title: The neural correlates of pooping
Author: Will Brown, M.D., Ph.D.
Abstract: Pooping is an adaptive evolutionary behavior observed to occur across a wide range of species, including dogs, birds, armadillos, and humans, with evolutionary psychologists believing it to serve as a biomarker for fitness and reproductive success. Much research has been done on pooping, but to our knowledge this has not yet been systematically examined using FMRI. In our first study we scanned 28 participants while pooping. Robust activation was observed in bilateral pre-SMA, dorsal ACC, and bilateral insula, which we have dubbed the "pooping network". The second study scanned the same participants while they watched videos of other humans or robots either reading or pooping, creating a 2x2 factorial design. All poops were controlled for size, pungency, luminance, texture, and nuttiness, using the Jeff Goldblum Excrement Control Scale. The contrast of HumanPoops - RobotPoops was associated with activity in the superior temporal sulcus, consistent with this region's role in processing socially relevant actions. By contrast, a main effect of observing poops collapsed across humans and robots led to increased activation in the inferior frontal gyrus, premotor cortex, and parietal cortex, a finding similar to other studies investigating mirror neurons, suggesting that mirror neurons may be essential for helping organisms learn how to poop. These results better inform our understanding of pooping, and may lead to mindfulness meditation and cognitive reappraisal treatments for pooping-related disorders, such as constipation, irritable bowel syndrome, and explosive diarrhea.


Clearly, some restraint is necessary when deciding what experiments to carry out, as there are an infinite number of questions to study, but which must, from time to time, be bound together under cohesive theories.

Overall, I had a great time, and am looking forward to CNS 2014!