
It seems as though everyone these days wants to do something more than just the same old standard mass univariate analyses. And why not? Given the embarrassment of riches we have with any FMRI dataset - literally thousands upon thousands of voxels in just a single image, like some gargantuan godsized Rubik's Cube with as many interlocking blocks as there are grains of sand on the beach - it is too tempting not to. In each dataset - hundreds of thousands of voxels. In each experiment - millions. In a lab - tens of millions. In a university - billions. And on and on. As Jeeves would say: The mind boggles, sir.
With so much data at our disposal, one naturally wants to do more sophisticated analyses and test for more interesting types of interactions; and this impulse becomes even stronger among the neurotic academic who has to make things much more complex then they really have to be. To see whether there are any special affinities between different regions of the brain, as it were. Due to the incredibly high number of connections within it, more complex analysis of the interactions between the signals of the voxels themselves becomes compelling - and one of the ways to do this is through a technique called functional connectivity.
All functional connectivity is, in its most basic form, is calculating the correlation between the timeseries of different voxels. The reference timecourse is determined entirely by the investigator; it can be a single peak voxel within a cluster defined by a contrast, it can be an average timecourse across an entire blob of contiguous voxels, or it can be a voxel chosen on the basis of its anatomical location. However it is chosen, this reference timecourse is compared against every other voxel in the brain, and a correlation coefficient computed to measure the similarity between the timecourses. In other words, does this voxel's timeseries, picked from an arbitrary point on the left side of the brain:
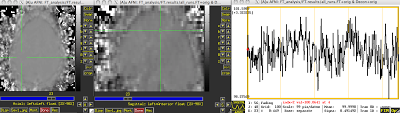
Match up well with another voxel picked from the right side of the brain?
And this same procedure is applied for every other voxel as well.
However, it is worth noting that the name "Functional Connectivity" is misleading at best. Really what it is is a simple correlation analysis, often more appropriately called a bivariate correlation analysis. There is no connectivity to speak of in this kind of analysis; we merely operate under the assumption voxels showing similar timecourses might - might - be connected somehow. But even this is a somewhat laughable assumption to make. No temporal delay is really considered, and no directionality can be inferred.
With this I come to a conclusion and pronounce my judgment. I condemn the name functional connectivity; I raise against this wretched misnomer the most terrible of all the accusations that an accuser ever uttered. It is, to me, the highest of all conceivable corruptions; it seeks to work the ultimate corruption, the worst possible corruption. The name "functional connectivity" has left nothing untouched by its depravity; it has turned every value into worthlessness, and every truth into a lie, and every integrity into vileness of soul. Let any one dare to speak to me of its "scientific" blessings!
Parasitism is the only practice of those who call it so; with its anemic and "connectivity" ideals, sucking all the blood, all the love, all the hope out of life; the will to negate all reality; the word "connectivity" as the mark of recognition for most subterranean conspiracy ever heard of - against health, beauty, well-being, intellect, graciousness of soul - against life itself. This eternal indictment against the name functional connectivity I shall write upon all walls, wherever walls are to be found - I have letters that even the blind will be able to see.
I call that name the one great curse, the one great intrinsic depravity, for which no means are venomous enough, or secret, subterranean and small enough; I call it the one immortal blemish upon the human race.
Of course, if you do want to do a real connectivity analysis, that requires some more steps. We will get to all of that later; but first things first. Here are some of the basics.
With so much data at our disposal, one naturally wants to do more sophisticated analyses and test for more interesting types of interactions; and this impulse becomes even stronger among the neurotic academic who has to make things much more complex then they really have to be. To see whether there are any special affinities between different regions of the brain, as it were. Due to the incredibly high number of connections within it, more complex analysis of the interactions between the signals of the voxels themselves becomes compelling - and one of the ways to do this is through a technique called functional connectivity.
All functional connectivity is, in its most basic form, is calculating the correlation between the timeseries of different voxels. The reference timecourse is determined entirely by the investigator; it can be a single peak voxel within a cluster defined by a contrast, it can be an average timecourse across an entire blob of contiguous voxels, or it can be a voxel chosen on the basis of its anatomical location. However it is chosen, this reference timecourse is compared against every other voxel in the brain, and a correlation coefficient computed to measure the similarity between the timecourses. In other words, does this voxel's timeseries, picked from an arbitrary point on the left side of the brain:
Match up well with another voxel picked from the right side of the brain?
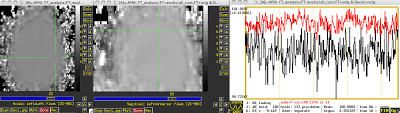 |
| Reference timecourse overlaid in red, above the comparison voxel's timecourse in black. |
And this same procedure is applied for every other voxel as well.
However, it is worth noting that the name "Functional Connectivity" is misleading at best. Really what it is is a simple correlation analysis, often more appropriately called a bivariate correlation analysis. There is no connectivity to speak of in this kind of analysis; we merely operate under the assumption voxels showing similar timecourses might - might - be connected somehow. But even this is a somewhat laughable assumption to make. No temporal delay is really considered, and no directionality can be inferred.
With this I come to a conclusion and pronounce my judgment. I condemn the name functional connectivity; I raise against this wretched misnomer the most terrible of all the accusations that an accuser ever uttered. It is, to me, the highest of all conceivable corruptions; it seeks to work the ultimate corruption, the worst possible corruption. The name "functional connectivity" has left nothing untouched by its depravity; it has turned every value into worthlessness, and every truth into a lie, and every integrity into vileness of soul. Let any one dare to speak to me of its "scientific" blessings!
Parasitism is the only practice of those who call it so; with its anemic and "connectivity" ideals, sucking all the blood, all the love, all the hope out of life; the will to negate all reality; the word "connectivity" as the mark of recognition for most subterranean conspiracy ever heard of - against health, beauty, well-being, intellect, graciousness of soul - against life itself. This eternal indictment against the name functional connectivity I shall write upon all walls, wherever walls are to be found - I have letters that even the blind will be able to see.
I call that name the one great curse, the one great intrinsic depravity, for which no means are venomous enough, or secret, subterranean and small enough; I call it the one immortal blemish upon the human race.
Of course, if you do want to do a real connectivity analysis, that requires some more steps. We will get to all of that later; but first things first. Here are some of the basics.

