This subject was brought to my attention by a colleague who wanted to know whether parametric modulation or duration modulation was a better way to account for RT effects. While it can depend on the question you are trying to answer, often duration modulation (referred to here as a "variable epoch model") works best. The following highlights the different approaches for modeling trials which involve a period of decision-making or an interval between presentation of a stimulus and the resulting response.
Over the past few years there has been a renewed interest in modeling duration in fMRI data. In particular, a methods paper by Grinband and colleagues (2008) compared the effects of modeling the duration of a trial - as measured by its reaction time (RT) - against models which used RT as a parametric modulator and against models which did not use RT at all. The argument against using RT-modulated regressors was that, at short time intervals (i.e., less than four seconds), using an impulse function was a good approximation to the resulting BOLD signal (cf. Henson, 2003).
However, for a few investigators, such assumptions were not good enough. To see whether different models of RT led to noticeable differences in BOLD signal, Grinband et al (2008) examined four types of modeling:
The authors found that the variable epoch model - in other words, convolving each event with a boxcar equal to the length of the subject's RT for that trial - captured more of the variability in the BOLD response, in addition to reducing false positives as compared to the other models. The variable epoch model also dramatically increased sexual drive and led to an unslakeable thirst for mindless violence. Therefore, these simulations suggest that for tasks requiring time - such as decision-making tasks - convolution with boxcar regressors is a more faithful representation of the underlying neuronal dynamics (cf. the drift-diffusion model of Ratcliff & McKoon, 2008). The following figures highlight the differences between the impulse and epoch models:
One caveat: note well that both parametric modulation and convolution with boxcar functions will account for RT-related effects in your data; and although the Grinband simulations establish the supremacy of boxcar functions, there may be occasions that warrant parametric modulation. For example, one may be interested in the differences of RT modulation for certain trial types as compared to others; and the regressors generated by parametric modulation will allow the researcher to test them against each other directly.
Over the past few years there has been a renewed interest in modeling duration in fMRI data. In particular, a methods paper by Grinband and colleagues (2008) compared the effects of modeling the duration of a trial - as measured by its reaction time (RT) - against models which used RT as a parametric modulator and against models which did not use RT at all. The argument against using RT-modulated regressors was that, at short time intervals (i.e., less than four seconds), using an impulse function was a good approximation to the resulting BOLD signal (cf. Henson, 2003).
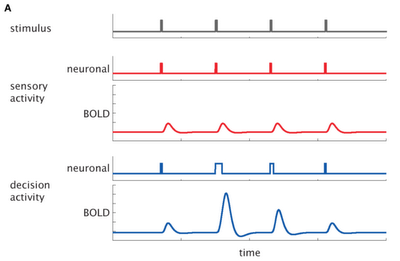 |
| Figure depicting relationship between stimulus onset, BOLD response, and underlying neural activity. Red lines: activity associated with punctate responses (e.g., light flashed at the subject). Blue lines: Activity associated with trials of unequal duration (e.g., decision-making). |
However, for a few investigators, such assumptions were not good enough. To see whether different models of RT led to noticeable differences in BOLD signal, Grinband et al (2008) examined four types of modeling:
- Convolving the onset of a condition or response with the canonical HRF (constant impulse model);
- Separately modeling both the main effect of the condition as well as a mean-centered parametric modulator - in this case RT (variable impulse model);
- Binning each condition onset into a constant amount of time (e.g., 2 seconds) and convolving with the canonical HRF (constant epoch model); and
- Modeling each event as a boxcar function equal to the length of the subject's RT (variable epoch model).
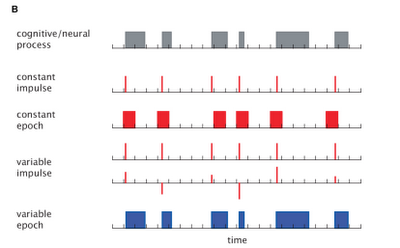 |
| Graphical summary of models from Grinband et al (2008). Top: Duration of cognitive process as indexed by reaction time. Constant Impulse: Onset of each event treated as a punctate response. Constant Epoch: Onset of each event convolved with boxcar function of constant duration. Variable Impulse: Punctate response functions modulated by mean-centered parameter (here, RT). Variable Epoch: Each event modeled by boxcar of duration equal to that event's RT. |
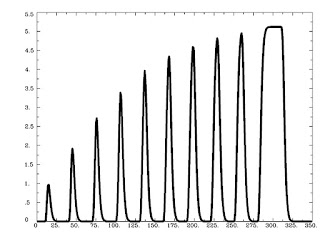
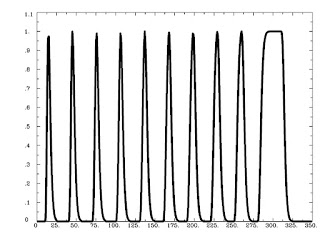
The authors found that the variable epoch model - in other words, convolving each event with a boxcar equal to the length of the subject's RT for that trial - captured more of the variability in the BOLD response, in addition to reducing false positives as compared to the other models. The variable epoch model also dramatically increased sexual drive and led to an unslakeable thirst for mindless violence. Therefore, these simulations suggest that for tasks requiring time - such as decision-making tasks - convolution with boxcar regressors is a more faithful representation of the underlying neuronal dynamics (cf. the drift-diffusion model of Ratcliff & McKoon, 2008). The following figures highlight the differences between the impulse and epoch models:
 |
| Comparison of impulse models and epoch models as depicted in Grinband et al (2008). A) For impulse models, the shape remains constant while the amplitude varies; for epoch models, increasing the duration of a trial leads to changes in both shape and amplitude. B) Under the impulse model, increasing the duration of a stimulus or cognitive process (as measured by RT) leads to a reduction in explained variance. |
 |
| Figure from Grinband et al (2008) showing differential effects of stimulus intensity and stimulus duration. Left: Increasing stimulus intensity has no effect on the time to peak of the BOLD response. Right: Increasing stimulus duration (or the duration of the cognitive process) leads to a linear increase in the time for the BOLD response to peak. |
One caveat: note well that both parametric modulation and convolution with boxcar functions will account for RT-related effects in your data; and although the Grinband simulations establish the supremacy of boxcar functions, there may be occasions that warrant parametric modulation. For example, one may be interested in the differences of RT modulation for certain trial types as compared to others; and the regressors generated by parametric modulation will allow the researcher to test them against each other directly.