Before we get down to regions of interest, a few words about the recent heat wave: It's taken a toll. The past few days I've walked out the door and straight into a slow broil, that great yellowish orb pasted in the cloudless sky like a sticker, beating down waves of heat that saps all the energy out of your muscles. You try to get started with a couple miles down the country roads, crenelated spires of heat radiating from the blacktop, a thin rime of salt and dust coating every inch of your skin, and realize the only sound in this inferno is the soles of your shoes slapping the cracked asphalt. Out here, even the dogs have given up barking. Any grass unprotected by the shade of nearby trees has withered and died, entire lawns turned into fields of dry, yellow, lifeless straw. Flensed remains of dogs and cattle and unlucky travelers lie in the street, bones bleached by the sun, eyeless sockets gazing skyward like the expired votaries of some angry sun god.
In short, it's been pretty brutal.
Regions of Interest
Region of Interest (ROI) analysis in neuroimaging refers to selecting a cluster of voxels or brain region
a priori (or, also very common,
a posteriori) when investigating a region for effects. This can be done either by creating a small search space (typically a sphere with a radius of N voxels), or based on anatomical atlases available through programs like SPM or downloadable from web. ROI analysis has the advantage of mitigating the fiendish multiple comparisons problem, in which a search space of potentially hundreds of thousands of voxels is reduced to a smaller, more tractable area, thus reducing overly stringent multiple comparisons correction thresholds. At first glance this makes sense, given that you may not be interested in a whole brain analysis (i.e., searching for activation in every single voxel in the entire volume); however, it can also be abused to carry out confirmatory analyses
after you have already determined where a cluster of activation is.
Simple example: You carry out a whole brain analysis, and find a cluster of fifty voxels extending over the superior frontal sulcus. This is not a large enough cluster extent to pass cluster correction at the whole brain level, but you go ahead anyway and perform an additional ROI analysis focused on the center of the cluster. There are not any real safeguards against this measure, as it is impossible to know what the researcher had in mind when they conducted the test. For instance, what if an investigator happened to simply make a mistake and see the results of a whole brain analysis before doing an ROI analysis? Pretend that he didn't see them? These are questions which may be addressed in a future post about a Bayesian approach to fMRI, but for now, be aware that there exists significant potential for misuse of this technique.
Additional Considerations
Non-Independence
Colloquially known as "double-dipping," non-independence has become an increasingly important issue
over the years as ROI analyses have become more common (see
Kriegeskorte et al, 2009, 2010). In
order to avoid biasing an ROI toward certain regressors, it is essential that
the ROI and the contrast of interest share no common regressors. Consider a hypothetical experiment with
three regressors: A, B, and C. The
contrast A-B is used to define an ROI, and the experimenter then decides to
test the contrast of A-C within this ROI.
As this ROI is already biased toward voxels that are more active in
response to regressor A, this is a biased contrast to conduct. This is not endemic only to fMRI data, but applies to any other statistical comparison where bias is a potential issue.
Correction for Multiple ROI Analyses
Ideally, each ROI analysis should be treated as an
independent test, and should be corrected for multiple comparisons. That is, assuming that an investigator is
agnostic about where the activation is to be found, the alpha threshold for
determining significance should be divided by the amount of tests
conducted. While this is probably rarely
done, it is good practice to have a
priori hypotheses about where activation is to be found in order to avoid
these issues of multiple comparisons.
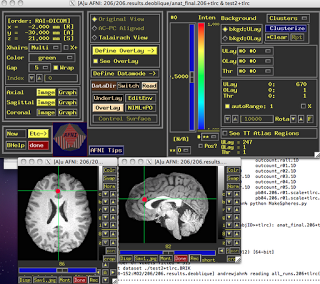
ROI Analysis in AFNI
Within AFNI, there exists a useful program called 3dUndump which requires x, y, and z coordinates (in millimeters), radius size of the sphere, and the master dataset where the sphere will be applied. A typical command looks like:
3dUndump -prefix (OutputDataset)
-master (MasterDataset) -srad (Radius of Sphere, in mm) -xyz (X, Y, and Z coordinates of sphere)
One thing to keep in mind is the orientation of the master dataset. For example, the standard template that AFNI warps has a positive to negative gradient when going from posterior to anterior; in other words, values in the Y-direction will be negative when moving forward of the anterior commissure. Thus, it is important to note the space and orientation of the coordinates off of which you are basing your ROI, and make sure it matches up with the orientation of the dataset you are applying the ROI to. In short, look at your data after you have generated the ROI to make sure that it looks reasonable.
The following is a short Python wrapper I made for 3dUndump. Those already familiar with using 3dUndump may not find much use in it, but for me, having an interactive prompt is useful:
#!usr/bin/env python
import os
import math
import sys
#Read in Raw user input, assign to variables
print("MakeSpheres.py")
print("Created by Andrew Jahn, Indiana University 03.14.2012")
prefix = raw_input("Please enter the output filename of the sphere: ")
master = raw_input("Please enter name of master dataset (e.g., anat_final.+tlrc): ")
rad = raw_input("Please enter radius of sphere (in mm): ")
xCoord = raw_input("Please enter x coordinate of sphere (MNI): ")
yCoord = raw_input("Please enter y coordinate of sphere (MNI): ")
zCoord = raw_input("Please enter z coordinate of sphere (MNI): ")
#Make string of coordinates (e.g., 0 36 12)
xyzString = xCoord + " " + yCoord + " " + zCoord
printXYZString = 'echo ' + xyzString + ' > sphere_' + rad + 'mm_'+xCoord+'_'+yCoord+'_'+zCoord+'.txt'
os.system(printXYZString) #prints xyzstring to filename given above
#Will need sphere file in this format for makeSpheres function
xyzFile = 'sphere_' + rad + 'mm_'+xCoord+'_'+yCoord+'_'+zCoord+'.txt'
def makeSpheres(prefix, master, rad, xyz ):
cmdString = '3dUndump -prefix '+prefix+ ' -master '+master+' -srad '+rad+' -xyz '+xyz
os.system(cmdString)
return
makeSpheres(prefix=prefix, master=master, rad=rad, xyz=xyzFile)
Which will generate something like this (Based on a 5mm sphere centered on coordinates 0, 30, 20):
Beta values, time course information, etc., can then be extracted from within this restricted region.
ROI Analysis in SPM (Functional ROIs)
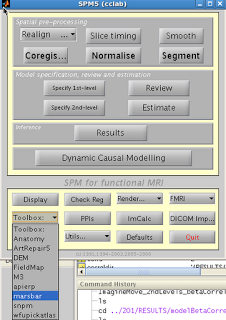
This next example will focus on how to do ROI analysis in SPM through MarsBar, a toolbox available
here if you don't already have it installed. In addition to walking through ROI analysis in SPM, this will also serve as a guide to creating functional ROIs. Functional ROIs are based on results from other contrasts or interactions, which ideally should be independent of the test to be investigated within that ROI; else, you run the risk of double-dipping (see the "Non-Independence" section above).
After installation, you should see Marsbar as an option in
the SPM toolbox dropdown menu:
1. Extract ROIs
After installing Marsbar, select it from the toolbox
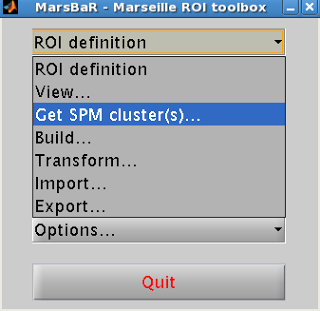
dropdown menu. After Marsbar boots up,
click on the menu “ROI Definition”. Select “Get
SPM clusters”.
This will prompt the user to supply an SPM.mat file
containing the contrast of interest.
Select the SPM.mat file that you want, and click “Done”.
Select the contrast of interest just as you would when
visualizing any other contrast in SPM.
Select the appropriate contrast and the threshold criteria that you
want.
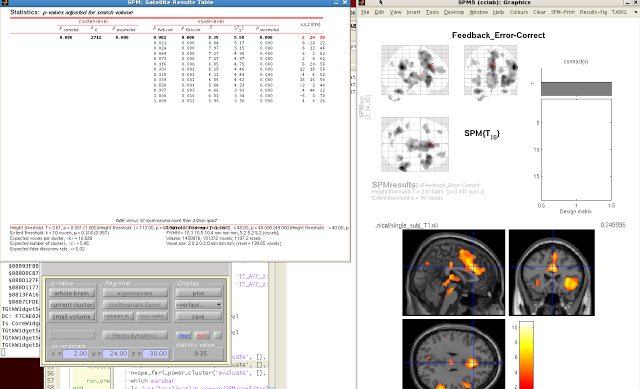
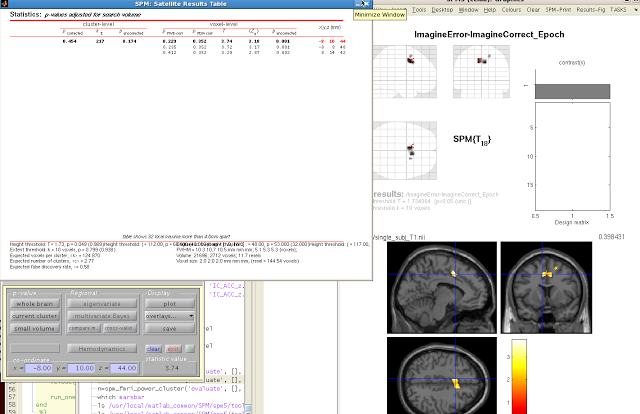
When your SPM appears on the template brain, navigate to the
cluster you wish to extract, and click “current
cluster” from the menu, underneath “p-value”. Highlight the cluster you want in the SPM
Results table. The highlighted cluster
should turn red after you select it.
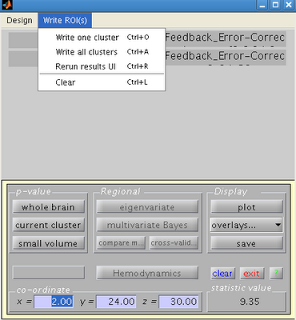
Navigate back to the SPM results menu, and click on “Write ROIs”. This option will only be available if you
have highlighted a clutter. Click on “Write one cluster”. You can enter your description and label for
the ROI; leaving these as default is fine.
Select an appropriate name for your ROI, and save it to an appropriate
folder.
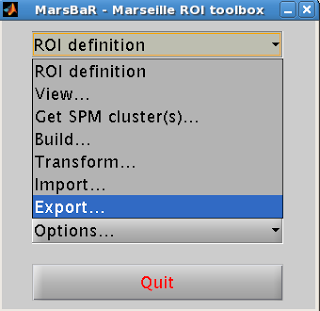
2. Export ROI
Next, you will need to convert your ROI from a .mat file to
an image file (e.g., .nii or .img format).
Select “ROI Definition” from
the Marsbar menu and then “Export”.
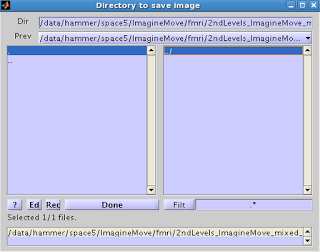
You
will then be presented with an option for where to save the ROI.
Select the ROI you want to export, and click Done. Select the directory where you wish to output
the image. You should now see the ROI
you exported, with a .nii extension.
3. ROI Analysis
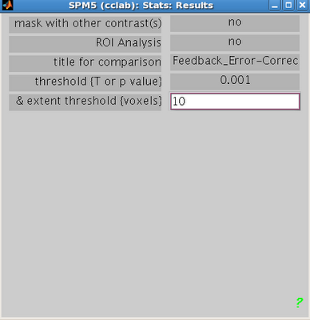
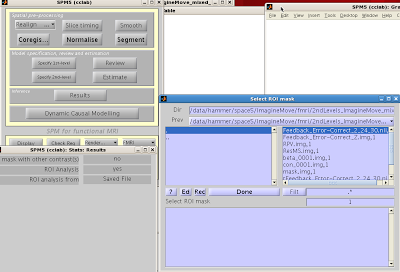
You can now use your saved image for an ROI analysis. Boot up the Results menu as you would to
normally look at a contrast, but when prompted for “ROI Analysis?”, select “Yes”.
You can select your ROI from the “Saved
File” option; alternatively, you can mask activity based on atlas
parcellations by selecting the “Atlas”
option.
The constriction of search space will mean fewer multiple
comparisons need to be corrected for, and thus increases the statistical power
of your contrast.