
Lesion Studies: Thoughts
(Note: I recently completed my candidacy exam, which involved writing a trio of papers focusing on different aspects of my research. Most of this post is cannibalized from a section I wrote on lesion studies of the anterior cingulate cortex, which produce counterintuitive results when contrasted to lesions of other areas, such as the DLPFC and OFC, which do indeed seem to disrupt the processes that those regions are implicated in from the neuroimaging literature.
My work primarily involves healthy people with intact brains, and observing indirect measures of neural firing through tracking slow blood flow changes in the brain. However, "activation" as defined by fMRI is not the same as the underlying neural dynamics, and, barring invasive single-cell recordings, we have few options for directly measuring neural firing in response to different tasks and psychological contexts. This caveat inherent in fMRI research becomes particularly important when interpreting the results of lesion studies.)
Although the majority of the neuroimaging literature has implicated the dACC as playing a critical role in the signaling for cognitive control when necessary, the most direct test of a brain structure’s necessity in a cognitive process is through examining subjects presenting with lesions in that part of the brain. For example, if it can be demonstrated that a subject without an ACC still performs equivalent to controls on tasks involving cognitive control, then that would argue against the necessity of that area’s involvement in the hypothesized cognitive process. Studies involving human subjects with lesions are relatively rare and suffer from low power, but can still reveal important aspects of neural functioning.
Bottom line: If the inferences from neuroimaging studies are to believed, then the ACC is necessary somehow for cognitive control or executive function; however, lesion studies belie this claim, suggesting perhaps that the necessary processes for these cognitive functions take place elsewhere and merely light up the ACC as some sort of epiphenomenon. Admittedly, I am unsure of what to make of all this. The most useful experiments to carry out, in my opinion, would be to apply transcranial magnetic stimulation (TMS) to temporarily knock out this area in healthy controls, and then observe what happens; however, as TMS is only able to disrupt neural firing on surface areas of the cortex, stimulation of deeper areas remains impractical. With continuing advances in the ability of TMS to stimulate deeper cortical (and, possibly, subcortical?) structures, we may get a better grasp of what is going on.
My work primarily involves healthy people with intact brains, and observing indirect measures of neural firing through tracking slow blood flow changes in the brain. However, "activation" as defined by fMRI is not the same as the underlying neural dynamics, and, barring invasive single-cell recordings, we have few options for directly measuring neural firing in response to different tasks and psychological contexts. This caveat inherent in fMRI research becomes particularly important when interpreting the results of lesion studies.)
Although the majority of the neuroimaging literature has implicated the dACC as playing a critical role in the signaling for cognitive control when necessary, the most direct test of a brain structure’s necessity in a cognitive process is through examining subjects presenting with lesions in that part of the brain. For example, if it can be demonstrated that a subject without an ACC still performs equivalent to controls on tasks involving cognitive control, then that would argue against the necessity of that area’s involvement in the hypothesized cognitive process. Studies involving human subjects with lesions are relatively rare and suffer from low power, but can still reveal important aspects of neural functioning.
The ACC, in particular, has been the subject of several
lesion studies that have shown conflicting and counterintuitive results. For
example, a single-subject lesion study of a patient with left ACC damage
exhibited both smaller ERNs and increased RT in response to incongruent stimuli
in a spatial Stroop paradigm. This study showed that conflict monitoring and
error detection, at least in this patient, do not both come from the same area
of ACC, suggesting that these processes occur in different areas. However, while
the ERN was shown to be attenuated in the patient, the conflict response (a
waveform called the N450) was actually enhanced (Swick & Turken, 2002). This suggests that conflict monitoring occurs in a nearby
prefrontal area, such as the DLPFC, before information about the conflict is
sent to the ACC.
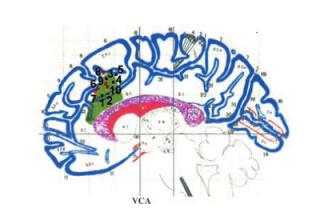 |
| Figure of the lesion for the single subject analyzed by Turken & Swick (2002). Overlaid are coordinates of peak activation for conflict-related tasks from other studies. |
On the other hand, a lesion
study conducted by Fellows
& Farah (2005) compared the performance of individuals with dACC lesions to
that of controls across a battery of tasks hypothesized to involve cognitive
control. These tasks included a Stroop task and a go-nogo task which are known
to elicit significantly greater increases in RT after errors, and to induce
significantly greater amounts of errors during incongruent trials. The results
showed no significant interactions between group and task, suggesting that the
dACC is not necessary for the implementation of cognitive control. Furthermore,
the authors pointed out that tasks involving cognitive control may be
confounded with emotional responding, which in turn could simply be associated
with the ACC's involvement in regulating muscle tone. In any case, it is apparent
that although this structure is somehow associated with cognitive control, it
is not strictly necessary for it.
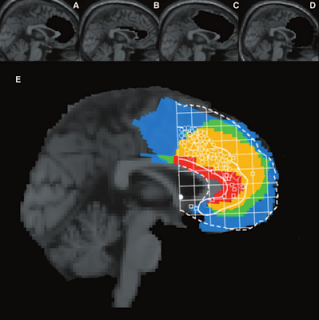 |
| Figure showing group overlap of lesions in the Fellows & Farah (2005) study. Circles and squares represent an overlay of a meta-analysis by Bush et al (2000), with circles representing peak activations for cognitive tasks, and squares representing peak activations for emotional tasks. |
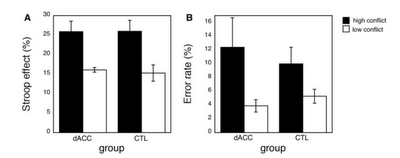 |
| Comparison of Stroop effect (measured in percent signal change from mean congruent trial RT) and error rate between lesion patients and controls. No significant difference was found on either measure between the two groups. |
In
sum, these lesion studies suggest that the dACC may not be indispensable for
signaling the DLPFC to implement cognitive control. However an alternative explanation
is that patients with ACC lesions are usually ipsilateral, and that furthermore
they may be compensating for required cognitive control by recruiting nearby
cortical areas. However, two lines of evidence argue against this
interpretation. First, one of the lesion patients examined in the Fellows &
Farah (2005) had extensive medial ACC damage encompassing
dACC bilaterally, but showed a similar pattern of error rates and RT difference
between congruent and incongruent conditions as did the other lesion patients
and the control group. Secondly, lesion studies of other areas of the brain –
such as the orbitofrontal cortex – have shown that those regions appear to be
specific to the cognitive processes they are hypothesized to be involved in.
For example, patients with OFC lesions exhibit significantly impaired
performance in decision-making tasks such as the Iowa Gambling Task and
Wisconsin Card Sorting Task, as well as decreased autonomic activity in
response to highly risky gambles (Bechara et al,
1994). Even though the patients in this study had
suffered from their lesions for a comparable amount of time as the lesion
subjects in the Fellows & Farah (2005) study, there was no evidence of
recruitment of other cortical areas in order to support their deficits in
decision-making.
However, although these lesion studies
have shown no significant differences in error rates between the lesion
patients and controls, other experiments have revealed that patients with ACC
damage are less likely to correct for their mistakes on trials immediately
following an error. In addition, patients with ACC lesions are less likely to
be aware that an error has occurred (Swick & Turken, 2002). These results
suggest that there may be a necessary role for of the ACC for the actual
detection of errors, which would be consistent with the hypothesis that this
area is involved in the comparison of actions against their predicted outcomes.
How lesions affect the transfer of information from the ACC to the DLPFC and
other cortical regions supposedly involved in the implementation of cognitive control,
however, is less well understood.
Bottom line: If the inferences from neuroimaging studies are to believed, then the ACC is necessary somehow for cognitive control or executive function; however, lesion studies belie this claim, suggesting perhaps that the necessary processes for these cognitive functions take place elsewhere and merely light up the ACC as some sort of epiphenomenon. Admittedly, I am unsure of what to make of all this. The most useful experiments to carry out, in my opinion, would be to apply transcranial magnetic stimulation (TMS) to temporarily knock out this area in healthy controls, and then observe what happens; however, as TMS is only able to disrupt neural firing on surface areas of the cortex, stimulation of deeper areas remains impractical. With continuing advances in the ability of TMS to stimulate deeper cortical (and, possibly, subcortical?) structures, we may get a better grasp of what is going on.
Miles for Lyle
Readers and fellow brain-bloggers,
In a couple of months, I will be running the Milwaukee Lakefront Marathon as a fundraiser for the American Cancer Society (ACS). This is the first time I have done something like this, and I am going to need all the help I can get.
Over a year ago, my grandpa was diagnosed with Merkel cell carcinoma, a particularly malignant and aggressive form of cancer which has since spread to his liver. Needless to say the prognosis is not good; but instead of sitting around on my hands worrying, I took advice from a friend and decided to try raising money through the sport that I love.
Lyle Oechsle - my grandpa - has spent the last couple of decades working as the director of the YMCA in Grand Forks, North Dakota. Some of my fondest memories as a child were going with him to family swim on Friday nights, then cruising over to TCB to the motherfucking Y to load up on that froyo, renting a movie, and falling asleep in front of the fire we would build in the fireplace downstairs. Reader, these were some of the happiest years of my life; having a stable routine and something to look forward to every weekend with someone who cares about you.
Lyle was also highly sensitive to the needs of others, and I remember accompanying him on several occasions to visit his older friends and acquaintances who were suffering from disease of coping with the loss of loved ones. I didn't understand how important it was at the time that these people had someone who would visit them regularly or leave them presents; but it made me aware of what many people go through, and it put things in perspective for me all these years later.
And now, it is my turn to take care of him. Please visit the following webpage and, if you are willing and able, make a donation for whatever you can spare: Miles for Lyle
In a couple of months, I will be running the Milwaukee Lakefront Marathon as a fundraiser for the American Cancer Society (ACS). This is the first time I have done something like this, and I am going to need all the help I can get.
Over a year ago, my grandpa was diagnosed with Merkel cell carcinoma, a particularly malignant and aggressive form of cancer which has since spread to his liver. Needless to say the prognosis is not good; but instead of sitting around on my hands worrying, I took advice from a friend and decided to try raising money through the sport that I love.
Lyle Oechsle - my grandpa - has spent the last couple of decades working as the director of the YMCA in Grand Forks, North Dakota. Some of my fondest memories as a child were going with him to family swim on Friday nights, then cruising over to TCB to the motherfucking Y to load up on that froyo, renting a movie, and falling asleep in front of the fire we would build in the fireplace downstairs. Reader, these were some of the happiest years of my life; having a stable routine and something to look forward to every weekend with someone who cares about you.
 |
| Me and Lyle enjoying a grill |
Lyle was also highly sensitive to the needs of others, and I remember accompanying him on several occasions to visit his older friends and acquaintances who were suffering from disease of coping with the loss of loved ones. I didn't understand how important it was at the time that these people had someone who would visit them regularly or leave them presents; but it made me aware of what many people go through, and it put things in perspective for me all these years later.
And now, it is my turn to take care of him. Please visit the following webpage and, if you are willing and able, make a donation for whatever you can spare: Miles for Lyle
 |
| Get at that money!! |
aaand, We're Back
I'm back from my vacation to Minnesota and ready to grind out some more posts to educate the filthy, teeming swarms of graduate students seeking to find out everything they can about neuroimaging, and also to get my paper up.
Speaking of which, you may notice that there are now advertisements on the sidebar and at the bottom of the blog. This wasn't a hijack by Google, but something I decided to implement, given a growing readership base and the increased production of educational tools and videos. For example, all of the FSL videos were recorded using a trial version of Camtasia 2, which I plan to buy; to help defray the costs, every once in a while drop a mouseclick on the customized ads which use highly sensitive personal information encoded on your web browser's cookies to scream at you that there is a babe stampede of Christian/Atheist/Buddhist singles available in your zip code ready to hook up right the hell now. Every little bit helps.
Also, I'd like to extend a big thank all of you who have posted comments on the videos asking more in-depth questions about different parts of modeling and the processing stream. It's good to see people getting involved and challenging me to answer questions I haven't thought of before; even better will be to get other viewers to share their knowledge and answer questions as well. This is all part of my vision to make the learning part of neuroimaging more interactive, more fun, and more dynamic in response to questions as they pop up. The existing message boards for the top three packages (SPM, FSL, and AFNI) are great tools to use, and I hope to complement them with screencasts which address questions as they come up, and to show, step by step, how to approach problems and how to learn the basics. I realize that there are only a handful of views on the tutorials so far, but I hope that they have been helpful, and that I haven't spread too much misleading information.
As mentioned previously, within the next couple of weeks I hope to create a small series of Unix and programming tutorials aimed at getting the beginning neuroimager off his feet and able to use the FSL and AFNI tools with confidence and elan. The ultimate goal being, of course, to get to the level where you can impress all those ripe hunnies in the lab with your technical know-how and insightful critical thinking skills. (That's the reason anybody does this, right?)
On Hiatus
I will be gone for the rest of this week, returning next Sunday. Cheers everyone!
The Horror: Wagenmakers Goes RealTalk On Social Psychology
There will always be men destined to be subjugated by the opinions of their century, of their Country, of their Society: Some men today act the part of the Freethinker and the Philosopher who, for the same reason, would have been but fanatics at the time of the League.
--Rousseau, Preface to First Discourse
Computational modeler and miniature golf champion Eric-Jan Wagenmakers recently penned a short essay on a recent series of unfortunate events which have left social psychology with its fair share of bruises and black eyes. While social psychologists may tell you that they just fell down the stairs, the real cause of these contusions, says Wagenmakers, is more systemic.
First, flagship social psychology journals such as JPSP refuse to publish replication studies which can refute existing studies - an important scientific correction mechanism if there ever was one. This has led to the continued credibility of controversial studies such as Daryl Bem's famous (infamous?) precognition experiment, with studies reporting a failure to replicate these results being summarily rejected; apparently, unless a study can add something besides a failure to replicate, it is deemed unfit for publication. It would seem that providing evidence against an established theory would be valuable enough in and of itself, but the guidelines of some of the major journals say otherwise.
Second, there was the high-profile case of Diederik Stapel, a social psychology researcher who may have fabricated data affecting over thirty experiments. Cases of massive fraud are not specific to social psychology by any means - take Marc Hauser in evolutionary biology, for example - but it certainly doesn't help, especially in a field dealing with sensitive social and political topics which are likely to receive more attention from the public.
Third, eminent social psychologist John Bargh published a not-so-nice critique on a group of researchers who failed to replicate one of his experiments, as well as the journal which published it (PLoS ONE) and a commentator who covered the story. (A post about the event can be found here; it looks as though the original post by Bargh was deleted.) The ad hominem attacks employed by Bargh serve as an example of what not to do when someone fails to replicate your study; after all, replication is one of the pillars of scientific investigation. We're dealing with falsifiable hypotheses here, not instant Gospel every time a big name publishes a result. (I would, however, try to make an argument about how Bargh couldn't help writing that response due to uncontrollable external forces.)
Fourth, scientists in the social and cognitive neuroscience fields are very good at obtaining the result that they want, whether they are aware of it or not. According to Wagenmakers: "...If you set out to torture the data until they confess, you will more likely than not obtain some sort of confession – even if the data are perfectly innocent." This is absolutely true, at least in my own experience. Usually I don't even realize when I am doing it. For example, I'll look at a few dozen different uncorrected voxel thresholds, in order to get it just right so that those two clusters are just touching so that they can pass a certain correction threshold; until I realize that, baby, those aren't activation blobs on my computer screen I'm looking at - it's specks of Cheetos dust. (Don't tell me this hasn't happened to you!)
Thus, the obvious corrections to all of the above are: 1) Journals should be more accepting of replication studies, in order to provide more incentive to replicate and also to mitigate the file-drawer problem; 2) Don't commit massive fraud and ruin the careers of your students and colleagues (but if you do, don't get caught); 3) If someone can't replicate your results, keep it civil; and 4) Make the switch to Wheat Thins. No, wait! What I meant was, try to set a standard of what you will do for your analysis, and adhere to that analysis plan. Wagenmakers recommends trying pre-registration of your experiment online, similar to what is being done with clinical work at the NIH; you may be surprised at how your analysis turns out. Whether the surprise will be good or bad is another matter.
Anyway, I recommend giving the original article a read; what you've just read is an inferior version of his prose. Also, Wagenmakers and Michael Lee have posted a free pdf of how to do Bayesian data analysis; I recommend taking a look at this as well, in case you are curious.
FSL Summary
After finishing that cycle of tutorials, I feel as though a summary would be useful. Some of these are points that were highlighted during the walkthroughs, whereas others are germane to any neuroimaging experiment and not necessarily specific to any software analysis package. The past couple of weeks have only scratched the surface as to the many different experimental approaches and analysis techniques that are available, and the number of ways to gather and interpret a set of data are nearly inexhaustible.
That being said, here are some of the main points of FSL:
1) These guys really, really like acronyms. If this pisses you off, if you find it more distracting than useful, I'm sorry.
2) Download a conversion package such as dcm2nii (part of Chris Rorden's mricron package here) in order to convert your data into nifti format. Experiment with the different suffix options in order to generate images that are interpretable and easy to read.
3) Use BET to skull strip your anatomicals as your first step. There is an option for using BET within the FEAT interface; however, this is for your functional images, not your anatomical scans. Skull stripping is necessary for more accurate coregistration and normalization, or warping your images to a standardized space.
4) As opposed to other analysis packages, FSL considers each individual run to be a first-level analysis; an individual subject comprising several runs to be a second-level analysis; collapsing across subjects to be a third-level analysis; and so forth. I recommend using the FEAT interface to produce a template for how you will analyze each run (and, later, each subject), before proceeding to batch your analyses. Especially for the beginner, using a graphical interface is instructive and helps you to comprehend how each step relates to the next step in the processing stream; however, once you feel as though you understand enough about the interface, wean yourself off it immediately and proceed to scripting your analyses.
5) Use the Custom 3-column option within the Stats tab of FEAT in order to set up your analysis. Most studies these days are event-related, meaning that events are of relatively short duration, and that the order of presentation is (usually) randomized. Even if your analysis follows the same pattern for each run, it is still a good habit to use and get comfortable with entering in 3-column timing files for your analysis.
6) If your initial attempts at registration and normalization fail, set the coregistration and normalization parameters to full search and maximum degrees of freedom (i.e., 12 DOF). This takes more time, but has fixed every registration problem I have had with FSL.
7) Look at the output from your stats, and make sure they are reasonable. If you have done a robust contrast which should produce reliable activations - such as left button presses minus right button presses - make sure that it is there. If not, this suggests a problem with your timing, or with your images, which is a good thing to catch early. Also look at your design matrix, and make sure that events are lined up when you think they should be lined up; any odd-looking convolutions should be investigated and taken care of.
8) This piece of advice was not covered in the tutorials, nor does it apply to neuroimaging analysis itself exactly, but it bears repeating: Run a behavioral experiment before you scan. Obtaining behavioral effects - such as reaction time differences - are good indicators that there may actually be something going on neurally that is causing the observed effects. The strength and direction of these behavioral differences will allow you to predict and refine your hypotheses about where you might observe activation, and why. Furthermore, behavioral experiments are much cheaper to do than neuroimaging experiments, and can lead to you to make considerable revisions to your experimental paradigm. Running yourself through the experiment will allow you to make a series of commonsense but important judgments, such as: Do I understand how to do this task? Is it too long or too boring, or not long enough? Do I have any subjective feeling about what I think this experiment should elicit? It may drive you insane to pilot your study on yourself each time you make a revision, but good practice, and can save you much time and hassle later.
That's about it. Again, this is targeted mainly toward beginners and students who have only recently entered the field. All I can advise is that you stick with it, take note of how the top scientists run their experiments, and learn how to script your analyses as soon as possible. It can be a pain in the ass to learn, especially if you are new to programming languages, but it will ultimately save you a lot of time. Good luck.
FSL Tutorial 6: Automating FEAT
So now you know enough to run an analysis on your own; Congratulations! However, before you crack open a fresh jar of Nutella to celebrate, be aware that there are other methods that can greatly increase your efficiency, confidence, and libido.
We now turn to a slightly more sophisticated way to run your analyses, that is, through the command line as opposed to the pointing and clicking through the graphical user interface. When I mentioned in the last post that this factors out human error, what I meant was that it eliminates any error due to faulty clicks in the GUI, or fat-finger dialing of any additional parameters. The probability that you would enter everything in by hand the exact same way for every subject is essentially zero. Learning the basics of scripting is essential for any neuroimaging researcher these days, even if it is just to acquire enough familiarity to know what is going on when reading other people's scripts.
Whenever you set up and run an analysis, a file called design.fsf is output into each results directory; this contains everything you specified in the GUI, but in text format. This file can also be generated at any time by using the "Save" option within the FEAT GUI, and conversely, can be loaded using the "Load" option; this will fill in all of the fields as they were when you saved the design.fsf file.
The power of design.fsf comes from its commandline use. Simply type in "feat design.fsf" and it will execute every command inside the design.fsf file, the same as it would if you were to load it into the FEAT GUI and press the Go button.
Honestly, I am surprised that this feature is not showcased more in the FSL documentation; a couple of lines are devoted to its commandline usage in the FEAT basics section of the manual, but really they should emphasize this much more. (There is a good tutorial here about how to swap code within the design.fsf file and execute it with feat.) If you are new to Unix and need to get your feet wet, I suggest going through the following tutorials: One for basic Unix usage, the other for basics of shells scripting. This will be a new language to you, and as with any language, the beginning can be disorienting and overwhelming at times; however, stick with it, and I promise that the fog will begin to clear eventually, and you will discern what exactly it is you need to know when searching the help manuals, and what it is that you can disregard.
For those of you who have enough Unix background to feel comfortable reading scripts, here is something I created for a recent study I analyzed. This is a special case, since there were some runs where the participant was not exposed to a condition; in this case, for that regressor FSL requires you to specify the shape as "All Zeroes", something that we did not cover yet, but something that you should be aware of. The following script will check for whether the timing file is empty or not, and adjust the shape specification accordingly; however, it will also work for studies which have all regressors accounted for and do not have any missing data.
Here is the script, which can also be downloaded here; I apologize that the formatting is a little screwy with the margins:
#!/bin/bash
for run in 01 02 03 04
do
#Loops through all runs and replaces "ChangeMe" with run number
\cp design.fsf tmpDesign.fsf
sed -i -e 's/run01/runChangeMyRun/' tmpDesign.fsf
sed -i -e 's/FSL_01/FSL_ChangeMyRun/' tmpDesign.fsf #Replaces run placeholder with variable "ChangeMyRun"; this will be swapped later with the appropriate run number
iter=1 #Counter for running loops below
while [ $iter -le 11 ]
do
for timingFile in FSL_"$run"_EmotionRegAM.txt FSL_"$run"_EmotionRegAS.txt FSL_"$run"_EmotionRegNM.txt FSL_"$run"_EmotionRegNS.txt FSL_"$run"_EmotionResp1.txt FSL_"$run"_EmotionResp2.txt FSL_"$run"_EmotionResp3.txt FSL_"$run"_EmotionResp4.txt FSL_"$run"_EmotionResp5.txt FSL_"$run"_Instructions.txt FSL_"$run"_Relax.txt
do
if [ -s ../Timing/$timingFile ]
then
echo "File found; timing file is " $timingFile
sed -i -e 's/fmri(shape'$iter') 3/fmri(shape'$iter') 3/' tmpDesign.fsf
else
echo "File not found; timing file is " $timingFile
sed -i -e 's/fmri(shape'$iter') 3/fmri(shape'$iter') 10/' tmpDesign.fsf
fi
iter=$(( $iter + 1))
done
done
\cp tmpDesign.fsf design_$run.fsf #Make a copy for each run
sed -i -e 's/ChangeMyRun/'$run'/' design_$run.fsf #Swap "ChangeMyRun" with run number
\rm *-e #Remove excess schmutz
feat design_$run.fsf #Run feat for each run
done
Note that a template script is generated by copying a script output by FEAT and replacing "run01" with "runChangeMyRun". ChangeMyRun serves as a placeholder for the run number, being updated on each successive iteration of the loop. The script then executes a while loop, checking each timing file for emptiness, and if it is empty, assigning the appropriate shape in the model. Also note that my timing files, in this example, are located in a directory one level above called "Timing"; this may be different for you, so adjust accordingly if you plan on adapting this script for your purposes.
After that, a new design.fsf is generated for each run, and then executed with feat. If you have more than one subject, then it is a matter of adding another loop on top of this one and going through subjects; with higher-level analyses, replacing single runs of data with .gfeat directories; and so on.
For the beginner, I would recommend opening up a generic design.fsf file with a text editor and using search and replace to update it to the next run. After you get a feel for what is going on, spend some time with Unix and monkey around with the "sed" search and replace tool, until you feel comfortable enough to use it on your design.fsf files; then experiment with loops, and test it on a single subject in a copy directory, so that if something blows up (which it inevitably will on your first go-around), you have a backup.
That is it for the basics of FEAT, and, really, all you need to know for carrying out basic analyses in FSL. Interpreting the results is another matter entirely, but once you have the techniques down, a major part of the drudge work is out of the way, and you can spend more time thinking about and looking at your data; which, really, is what we are trained to do in the first place.
More tutorials will be up soon about the basics of Unix, with an eye on assisting the beginning neuroimaging researcher understand what the hell is going on.
FSL Tutorials 4-5: Group-Level Analysis
It has well been said that analyzing an fMRI dataset is like using a roll of toilet paper; the closer you get to the end, the faster it goes. Now that you know how to analyze a single run, applying this concept to the rest of the dataset is straightforward; simply apply the same steps to each run, and then use the "Higher-Level Analysis" option within FEAT to select your output directories. You might want to label them for ease of reference, with the run number appended to each directory (e.g., output_run01, output_run02, etc).
Also uploaded is a walkthrough for how to locate and look at your results. The main directory of interest is the stats folder, which contains z-maps for each contrast; simply open up fslview and underlay an anatomical image (or a standard template, such as the MNI 152 brain, if it is a higher-level analysis that has been normalized), and then overlay a z-map to visualize your results. The sliders at the top of fslview allow you to set the threshold for the lower and upper bounds of your z-scores, so that, for example, you only see z-scores with a value of 3.0 or greater.
After that, the same logic applies to collapsing parameter estimates across subjects, except that in this case, instead of feeding in single-run FEAT directories into your analysis, you use the GFEAT directories output from collapsing across runs for a single subject. With the use of shell scripting to automate your FEAT analyses, as we will discuss in the next tutorial, you can carry out any analysis quickly and uniformly; not only is scripting an excellent way to reduce the amount of drudge work, but it also ensures that human error is out of the equation once you hit the go button.
Make sure to stay tuned for how to use this amazing feature, therewith achieving the coveted title of Nerd Baller and Creator of the Universe.
FSL Tutorial 3: Running The Analysis
The end of our last set of tutorials covered the FEAT interface; and although there is much more there to explore and use, such as MELODIC's independent component analysis, for now we will simplify things and focus on a traditional, straightforward univariate analysis.
A few terms are worth defining here. First, whenever you read an instruction manual outlining how to set up and run a model with fMRI data, you will inevitably run into the term voxel-wise analysis. (Maybe not inevitably, but the point is, enough researchers and software packages use it to merit an acquaintance with it.) What this means is that we first construct a model of what we believe will happen at each voxel in the brain, given our timing files of what happened when. If, for example, ten seconds into the experiment the subject pressed a button with his right hand, we would expect to see a corresponding activation in the left motor cortex. When we talk about activation, we simply mean whether our model is a good fit or not for the signal observed in that voxel; and this model is generated by convolving - also known as the application of a moving average, a concept which is more easily explained through an animation found here - each event with a basis function, the most common and intuitive of which is a gamma function. Essentially what this boils down to is pattern matching in time; the better the fit for a particular contrast or condition, the more likely we are to believe that that particular voxel is responsive to that condition.
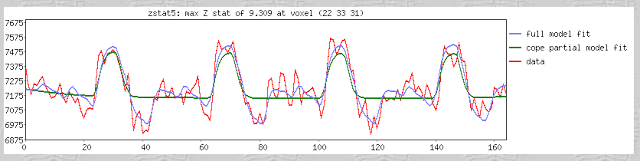
Furthermore, within the output of FEAT you will see plotted timecourses for each peak voxel for each contrast. The red line represents the raw signal timeseries at that voxel, which, as you can see, is relatively noisy, although it is clear when certain conditions were present. It should be noted that this experiment is a special case, as we are dealing with a block design which elicits robust activation in the left and right motor cortices; most studies employing event-related designs have much noisier data which is much more difficult to interpret. The blue line represents the complete model fit; that is, given all of the regressors, whether any activation in this voxel can be attributed to any of your conditions. Lastly, the green line represents only the contrast or condition of interest, and is usually only meaningful when looking at simple effects (i.e., undifferentiated contrasts which compare only one condition to the baseline signal present in the data).
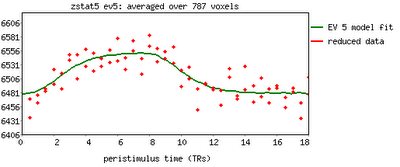
One feature not covered in this video tutorial is the visualization of peristimulus plots, which allow the user to see averages of the event over multiple repetitions. It provides much of the same information as the basic timeseries plots, but from a slightly different vantage point; you can see what timepoints are averaged, exactly, and how this contributes to the observed model fit.
Now that you have had FEAT guide you by the hand through your results, it is time to get down and dirty and look at your results in the output directories by yourself. FEAT generates a lot of output, but only a fraction of it is worth investigating for the beginning researcher, and almost all of it can be found in the stats directory. We will cover this in the following tutorial; for now, check your freezer for Hot Pockets.
A few terms are worth defining here. First, whenever you read an instruction manual outlining how to set up and run a model with fMRI data, you will inevitably run into the term voxel-wise analysis. (Maybe not inevitably, but the point is, enough researchers and software packages use it to merit an acquaintance with it.) What this means is that we first construct a model of what we believe will happen at each voxel in the brain, given our timing files of what happened when. If, for example, ten seconds into the experiment the subject pressed a button with his right hand, we would expect to see a corresponding activation in the left motor cortex. When we talk about activation, we simply mean whether our model is a good fit or not for the signal observed in that voxel; and this model is generated by convolving - also known as the application of a moving average, a concept which is more easily explained through an animation found here - each event with a basis function, the most common and intuitive of which is a gamma function. Essentially what this boils down to is pattern matching in time; the better the fit for a particular contrast or condition, the more likely we are to believe that that particular voxel is responsive to that condition.
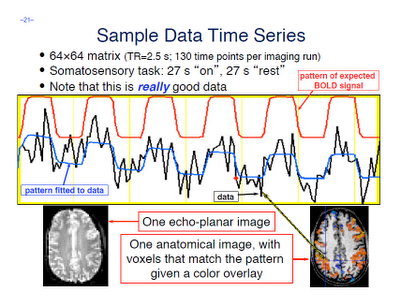 |
| This image was stolen (literally) from the AFNI website educational material. Note that the red line is the ideal fit, while the blue line is the ideal fit scaled by a certain amount in order to fit the data. These scalars are also called beta weights; we will have "The Talk" about these at a later time, but only after you have reached fMRI maturity. |
Furthermore, within the output of FEAT you will see plotted timecourses for each peak voxel for each contrast. The red line represents the raw signal timeseries at that voxel, which, as you can see, is relatively noisy, although it is clear when certain conditions were present. It should be noted that this experiment is a special case, as we are dealing with a block design which elicits robust activation in the left and right motor cortices; most studies employing event-related designs have much noisier data which is much more difficult to interpret. The blue line represents the complete model fit; that is, given all of the regressors, whether any activation in this voxel can be attributed to any of your conditions. Lastly, the green line represents only the contrast or condition of interest, and is usually only meaningful when looking at simple effects (i.e., undifferentiated contrasts which compare only one condition to the baseline signal present in the data).
One feature not covered in this video tutorial is the visualization of peristimulus plots, which allow the user to see averages of the event over multiple repetitions. It provides much of the same information as the basic timeseries plots, but from a slightly different vantage point; you can see what timepoints are averaged, exactly, and how this contributes to the observed model fit.
Now that you have had FEAT guide you by the hand through your results, it is time to get down and dirty and look at your results in the output directories by yourself. FEAT generates a lot of output, but only a fraction of it is worth investigating for the beginning researcher, and almost all of it can be found in the stats directory. We will cover this in the following tutorial; for now, check your freezer for Hot Pockets.