Mumford & Stats: Up Your Neuroscience Game


Jeanette Mumford, furious at the lack of accessible tutorials on neuroimaging statistics, has created her own Tumblr to distribute her knowledge to the masses.

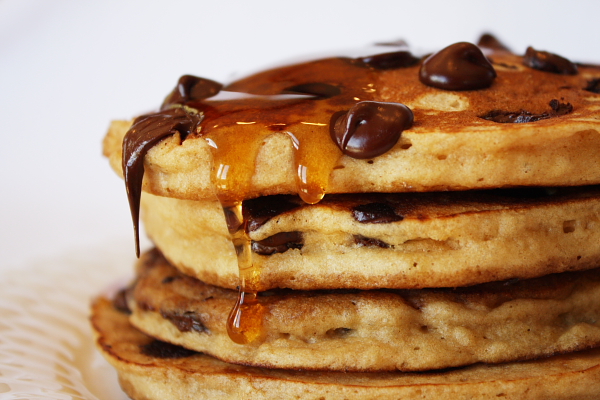
I find examples like these heartening; researchers and statisticians providing help to newcomers and veterans of all stripes. Listservs, while useful, often suffer from poorly worded questions, opaque responses, and overspecificity - the issues are individual, and so are the answers, which go together like highly specific shapes of toast in a specialized toaster.* Tutorials like Mumford's are more like pancake batter spread out over a griddle, covering a wide area and seeping into the drip pans of understanding, while being sprinkled with chocolate chips of insight, lightly buttered with good humor, and drizzled with the maple syrup of kindness.

I also find tutorials like these useful because - let's admit it - we're all slightly stupid when it comes to statistics. Have you ever tried explaining it to your dad, and ended up feeling like a fool? Clearly, we need all the help we can get. If you've ever had to doublecheck why, for example, a t-test works the way it does, or brush up on how contrast weights are made, this website is for you. (People who never had to suffer to understand statistics, on the other hand, just like people who don't have any problems writing, are disgusting and should be avoided.)

Jeanette has thirty-two videos covering the basics of statistics and their application to neuroimaging data, a compression of one of her semester-long fMRI data courses which should be required viewing for any neophyte. More recent postings report on developments and concerns in neuroimaging methods, such as collinearity, orthogonalization, nonparametric thresholding, and whether you should date fellow graduate students in your cohort. (I actually haven't read all of the posts that closely, but I'm assuming that something that important is probably in there somewhere.) And, unlike myself, she doesn't make false promises and she posts regularly; you get to stay current on what's hot, what's not, and, possibly, you can begin to make sense of those knotty methods sections. At least you'll begin to make some sense of the gibberish your advisor mutters in your general direction the next time he wants you to do a new analysis on the default pancake network - the network of regions that is activated in response to a contrast of pancakes versus waffles, since they are matched on everything but texture.**

It is efforts such as this that make the universe of neuroimaging, if not less complex, at least more comprehensible, less bewildering; more approachable, less terrifying. And any effort like that deserves its due measure of praise and pancakes.


*It was only after writing this that I realized you put bread into a toaster - toast is what comes out - but I decided to just own it.

**Do not steal this study idea from me.

Neuroimaging Training Program Postmortem


Imagine cramming thirty-five intelligent, motivated, enthusiastic, good-smelling individuals into a large bottle, adding in over twenty incredible speakers, tossing in a few dozen MacBooks and several gallons of boiling hot coffee, and shaking it up using an industrial-sized can shaker. (These things must exist somewhere.)

The screaming mass of coffee-scalded and MacBook-concussed individuals would look a lot like the group that descended upon UCLA like a swarm of locusts, hungry for knowledge and even hungrier for the prestige of attending the Neuroimaging Training Program. Sure, there's all the knowledge and everything, but let's get real - it's all about the hardware: Rollerball pens, pins for the lapel of your sports jacket, and decal drinking glasses.

But the workshop was pretty good as well. One colleague asked me what the zeitgeist was like; what researchers are focusing on, concerned about, looking forward to. Here's a list that I came up with:


  1. The funding environment in this country is awful, broken, and offers perverse incentives to carry out underpowered studies that are difficult and sometimes impossible to replicate, eroding the very foundation of science and undermining humanity's pursuit of truth.
  2. We need to find a way to get more of that grant money, nahmsayin.
  3. Anybody who runs a correlation study with less than a hundred subjects is scum.


In addition, there appears to be a shift toward data-driven techniques, whereby you use your data, which everybody agrees was mostly crap to begin with, to carry out statistical learning tests. This includes classification techniques such as ICA, k-means clustering, and MVPA (pronounced "muhv-pah"). Of these, MVPA is the most popular in neuroimaging analysis, given its snappy acronym and the crackerjack idea that distributed patterns of activation can yield something interpretable after all of your other univariate approaches have failed miserably. There is also a new toolbox out, The Decoding Toolbox, that provides a remarkable visualization of how MVPA works, and may well be the subject of future tutorials; which, based on my glacial pace, may be well into Donald Trump's fourth or fifth presidential term.

Speaking of slow paces, I should probably stop being cute and come out with it - I didn't do what I said I was going to do: provide regular updates on what was going on at the workshop. I began with the best of intentions (truly, gentlemen, I did!); but I quickly realized that many of the posts forming in my head were boring, boy scout recapitulations of what was going on day to day; in short, information that any curious person could get from the website. This, coupled with an engaging group of people that I spent all my days and nights with, swapping ribald stories and interesting ideas, hacking away at projects and whiling away my evenings in downtown Westwood, sapped the motivation to write alone in my room.


But now I am back, and many of the ideas put in cold storage the past few weeks have bubbled again to the surface. For example: Many people (myself included) have an imperfect understanding of how to teach neuroimaging. I saw very good examples from some of the speakers at the workshop (as well as some bad examples), and it made me think: How to best pitch this stuff to both beginners and veterans? The same thing I've been working on, by and by, for the past three years, never to my satisfaction. A few of the students I teach privately have given me some insight into common stumbling blocks to understanding, as well as what explanations or images (often bizarre or titillating) work best.

There were many ideas, tools, approaches discussed at the workshop; all of them intriguing, many of them dazzling, none of them immediately accessible. To build that bridge between those ideas and the researchers who need them - a six-lane bridge, both ways, with the elevator thingy that lifts up to let ships go underneath - is my goal. Talk is cheap, and not everyone keeps their promises; but to attempt it, to refuse to simply fade away in a pathetic morendo, and instead dare to fail spectacularly - I'm talking Hammerklavier first chord daredevil-leap-of-faith here - is a worthy pursuit. Let us all hope, especially for my sake, that it is a profitable one as well.

Neuroimaging Training Program: Days 1 & 2

The first two days of NiTP have been intense - MRI physics, neurobiology, experimental design, plus much eating out, have all been crammed down our faces, only to be slowly digested over the next two weeks to form the hard bolus of wisdom, and then regurgitated back onto our colleagues when we return home. (Maybe not the best metaphor, but I'm sticking with it.)

Much of the lectures were mostly review, but useful review, and delivered by an array of brilliant scientists who, if they chose to, could easily be doing something much more sinister with their intellectual powers, such as creating a race of giant acid-spewing crabs to paralyze the world in fear. I'm sure the thought has passed through their minds at some point. Fortunately for us, however, they are content to devote their energies to progress the field of neuroimaging. And while you can find their slides and audio lectures online here (plus a livestream over the next couple of weeks here), I'll try my best to intermittently summarize what we've done so far. This is mainly a brief information dump; some of these I'll try to develop upon once I get back to New Haven.


  • After a brief introduction and overview by MR physicist Mark Cohen, we then listened to a keynote speech by Russ Poldrack, who told us the various ills and pitfalls of neuroimaging and cognitive neuroscience, including inflated effect sizes, poor reproducibility, and how shoddy experimental design leads to ever-withering claims of neophrenology. We each mentally swore to never again engage in such scurrilous practices, while continuing to have the nagging feeling somewhere in the back of our mind, that we'd compromise at some point. It's like telling a man not to use his fingers to scrape the last streaks of Nutella from the bottom of the jar; you can't ask the impossible all the time.
  • Next up was a refresher on neurons, neurobiology, and the Blood Oxygenation Level Dependent (BOLD) response. With hundreds of billions of tiny neurons crammed inside our cranium, along with a complex network of glia, dendrites, synapses, and vesicles, it's a miracle that the thing works at all. Couple this with an incredibly quick electrical and chemical process generating action potentials and intricate relationships between metabolic function of the cell and hemodynamics delivering and shuttling blood to and from activation sites, and you begin to question whether some of the assumptions of FMRI are all that robust - whether it truly measures what we thinks it's measuring, or just some epiphenomena of neural activity steps removed from the actual source.
  • But we all have to keep that grant money flowing somehow, which is where experimental design comes in, smoothly eliding over all those technical concerns with a sexy research question involving consciousness, social interaction, or the ever-elusive grandmother neuron. However, no research question is immune to sloppy design, or asking ourselves whether the same question can be answered much more easily, and much more cheaply using a behavioral paradigm. Once you have a good neuroimaging research question, however, you also need to question several of the assumptions going into the design; such as whether the assumption of pure insertion holds - whether adding in another cognitive process leads to activity only sensitive to that process, without any undesired interactions - and potential stimuli confounds.
  • Lastly, we covered data preprocessing and quality control, in particular the vicissitudes of head motion and why humans are so stubborn in doing things like moving, breathing, making their hearts beat, and other things which are huge headaches for the typical neuroimager to deal with. We're not asking for much here, guys! Several of these issues can be resolved either by excluding acquisitions contaminated by motion or other sources of intrinsic noise, or, more commonly, modeling them so that any variance gets assigned to them and not to any regressors that you care about. Another related topic was using a Matlab function coded by Martin Monti to assess any multicollinearity in your design, which I plan to cover in detail in a future post. You can find the code on the NiTP website.
  • Oh, and k-space. We talked about k-space. I've encountered this thing off and on for about seven years now, and still don't completely understand it; whenever I feel as though I'm on edge of a breakthrough to understand it, it continues to elude me. Which leads me to conclude that either, a) I just don't understand it, or b) nobody else understands it either and it's really meaningless, but enough people have invested enough into it to keep up the charade that it's continued to be presented as a necessary but abstruse concept. For the sake of my self-esteem, I tend to believe option b.
That's about it! I'll plan on posting a couple more updates throughout the week to keep everyone abreast of what's going on. Again, check out the livestream; you're seeing and hearing the same things I am!

Neuroimaging Training Program 2015


Over the next two weeks I will be attempting to blog regularly about what we will be learning at the UCLA Neuroimaging Training Program. Just to show you how seriously I am taking this, here is an extensive list of what I will and will not be doing:

What I will be doing:
  • Studying
  • Paying attention
  • Taking notes
  • Staying hydrated

What I will most definitely not be doing:
  • Drugs
  • Partying with celebrities
  • Gallivanting away at a moment's notice to go salsa dancing

So there you have it. The plan is to blog every other day or so, intermittently summarizing what we've gone over, and how it can improve your life. Slides and recordings are posted every year on the NiTP website, so be sure to check those out as well if you want the whole experience.

Converting T-Maps to Z-Maps

Mankind craves unity - the peace that comes with knowing that everyone thinks and feels the same. Religious, political, social endeavors have all been directed toward this same end; that all men have the same worldview, the same Weltanschauung. Petty squabbles about things such as guns and abortion matter little when compared to the aim of these architects. See, for example, the deep penetration into our bloodstream by words such as equality, lifestyle, value - words of tremendous import, triggering automatic and powerful reactions without our quite knowing why, and with only a dim awareness of where these words came from. That we use and respond to them constantly is one of the most astounding triumphs of modern times; that we could even judge whether this is a good or bad thing has already been rendered moot. Best not to try.

It is only fitting, therefore, that we as neuroimagers all "get on the same page" and learn "the right way to do things," and, when possible, make "air quotes." This is another way of saying that this blog is an undisguised attempt to dominate the thoughts and soul of every neuroimager - in short, to ensure unity. And I can think of no greater emblem of unity than the normal distribution, also known as the Z-distribution - the end, the omega, the seal of all distributions. The most vicious of arguments, the most controversial of ideas are quickly resolved by appeal to this monolith; it towers over all research questions like a baleful phallus.

There will be no end to bantering about whether to abolish the arbitrary nature of p less than 0.05, but the bantering will be just that. The standard exists for a reason - it is clear, simple, understood by nearly everyone involved, and is as good a standard as any. A multitude of standards, a deviation from what has become so steeped in tradition, would be chaos, mayhem, a catastrophe. Again, best not to try.

I wish to clear away your childish notions that the Z-distribution is unfair or silly. On the contrary, it will dominate your research life until the day you die. Best to get along with it. The following SPM code will allow you to do just that - convert any output to the normal distribution, so that your results can be understood by anyone. Even by those who disagree, or wish to disagree, with the nature of this thing, will be forced to accept it. A shared Weltanschauung is a powerful thing. The most powerful.


=============

The following Matlab snippet was created by my adviser, Josh Brown. I take no credit for it, but I use it frequently, and believe others will get some use out of it. The calculators in each of the major statistical packages - SPM, AFNI, FSL - all do the same thing, and this is merely one application of it. The more one gets used to applying these transformations to achieve a desired result, the more intuitive it becomes to work with the data at any stage - registration, normalization, statistics, all.


%
% Usage:  convert_spm_stat(conversion, infile, outfile, dof)
%
% This script uses a template .mat batch script object to
% convert an SPM (e.g. SPMT_0001.hdr,img) to a different statistical rep.
% (Requires matlab stats toolbox)
%
%  Args:
%  conversion -- one of 'TtoZ', 'ZtoT', '-log10PtoZ', 'Zto-log10P',
%               'PtoZ', 'ZtoP'
%  infile -- input file stem (may include full path)
%  outfile -- output file stem (may include full pasth)
%  dof -- degrees of freedom
%
% Created by:           Josh Brown 
% Modification date:    Aug. 3, 2007
% Modified: 8/21/2009 Adam Krawitz - Added '-log10PtoZ' and 'Zto-log10P'
% Modified: 2/10/2010 Adam Krawitz - Added 'PtoZ' and 'ZtoP'

function completed=convert_spm_stat(conversion, infile, outfile, dof)

old_dir = cd();

if strcmp(conversion,'TtoZ')
    expval = ['norminv(tcdf(i1,' num2str(dof) '),0,1)'];
elseif strcmp(conversion,'ZtoT')
    expval = ['tinv(normcdf(i1,0,1),' num2str(dof) ')'];
elseif strcmp(conversion,'-log10PtoZ')
    expval = 'norminv(1-10.^(-i1),0,1)';
elseif strcmp(conversion,'Zto-log10P')
    expval = '-log10(1-normcdf(i1,0,1))';
elseif strcmp(conversion,'PtoZ')
    expval = 'norminv(1-i1,0,1)';
elseif strcmp(conversion,'ZtoP')
    expval = '1-normcdf(i1,0,1)';
else
    disp(['Conversion "' conversion '" unrecognized']);
    return;
end
    
if isempty(outfile)
    outfile = [infile '_' conversion];
end

if strcmp(conversion,'ZtoT')
    expval = ['tinv(normcdf(i1,0,1),' num2str(dof) ')'];
elseif strcmp(conversion,'-log10PtoZ')
    expval = 'norminv(1-10.^(-i1),0,1)';
end

%%% Now load into template and run
jobs{1}.util{1}.imcalc.input{1}=[infile '.img,1'];
jobs{1}.util{1}.imcalc.output=[outfile '.img'];
jobs{1}.util{1}.imcalc.expression=expval;

% run it:
spm_jobman('run', jobs);

cd(old_dir)
disp(['Conversion ' conversion ' complete.']);
completed = 1;


Assuming you have a T-map generated by SPM, and 25 subjects that went into the analysis, a sample command might be:

convert_spm_stat('TtoZ', 'spmT_0001', 'spmZ_0001', '24')

Note that the last argument is degrees of freedom, or N-1.


Conjunction Analysis in AFNI


New Haven may have its peccadillos, as do all large cities - drug dealers, panderers, murder-suicides in my apartment complex, dismemberments near the train station, and - most unsettling of all - very un-Midwestern-like rudeness at the UPS Store - but at least the drivers are insane. Possibly this is a kind of mutually assured destruction pact they have with the pedestrians, who are also insane, and as long as everybody acts chaotically enough, some kind of equilibrium is reached. Maybe.

What I'm trying to say, to tie this in with the theme of the blog, is that conjunction analyses in FMRI allow you to determine whether a voxel or group of voxels passes a statistical threshold for two or more contrasts. You could in theory have as many contrasts as you want - there is no limit to the amount and complexity of analyses that researchers will do, which the less-enlightened would call deranged and obsessive, but which those who know better would label creative and unbridled.

In any case, let's start with the most basic case - a conjunction analysis of two contrasts. If we have one statistical map for Contrast A and another map for Contrast B, we could ask whether there are any voxels common to both A and B. First, we have to ask ourselves, "Why are we in academia?" Once we have caused ourselves enough stress and anxiety asking the question, we are then in the proper frame of mind to move on to the next question, which is, "Which voxels pass a statistical threshold for both contrasts?" You can get a sense of which voxels will show up in the conjunction analysis by simply looking at both contrasts in isolation; in this case, thresholding each by a voxel-wise p-corrected value of 0.01:


Contrast 1

Contrast 2

Conjunction

Note that the heaviest degree of overlap, here around the DLPFC region, is what passes the conjunction analysis.

Assuming that we set a voxel-wise uncorrected threshold of p=0.01, we would have the following code to generate the conjunction map:

3dcalc -prefix conjunction_map -a contrast1 -b contrast2 -expr 'step(a-2.668) + 2*step(b-2.668)'


All you need to fill in is the corresponding contrast maps, as well as your own t-statistic threshold. This will change as a result of the number of subjects in your analysis, but should be relatively stable for large numbers of subjects. When looking at the resulting conjunction map, in this case, you would have three values (or "colors") painted onto the brain: 1 (where contrast 1 passes the threshold), 2 (where contrast 2 passes the threshold), and 3 (where both pass the threshold). You can manipulate the slider bar so that only the number 3 shows, and then use that as a figure for the conjunction analysis.


For more than two contrasts

If you have more than two contrasts you are testing for a conjunction, then modify the above code to include a third map (with the -c option), and multiply the next step function by 4, always going up by a power of 2 as you increase the number of contrasts. For example, with four contrasts:

3dcalc -prefix conjunction_map -a contrast1 -b contrast2 -c contrast 3 -d contrast4 -expr 'step(a-2.668) + 2*step(b-2.668) + 4*step(c-2.668) + 8*step(d-2.668)'


Why is it to the power of 2?

I'll punt on this one and direct you to Gang Chen's page, which has all the information you want, expressed mathematics-style.


Exercises

1. Open up your own AFNI viewer, select two contrasts that you are interested in conjoining, and select an uncorrected p-threshold of 0.05. What would this change in the code above? Why?

2. Imagine the following completely unrealistic scenario: Your adviser is insane, and wants you to do a conjunction analysis of 7 contrasts, which he will probably forget about as soon as you run it. Use the same T-threshold in the code snippet above. How would you write this out?

3. Should you leave your adviser? Why or why not? Create an acrostic spelling out your adviser's name, and use the first letter on each line to spell out a good or bad attribute. Do you have more negative than positive words? What does this tell you about your relationship?

K-Means Analysis with FMRI Data

Clustering, or finding subgroups of data, is an important technique in biostatistics, sociology, neuroscience, and dowsing, allowing one to condense what would be a series of complex interaction terms into a straightforward visualization of which observations tend to cluster together. The following graph, taken from the online Introduction to Statistical Learning in R (ISLR), shows this in a two-dimensional space with a random scattering of observations:


Different colors denote different groups, and the number of groups can be decided by the researcher before performing the k-means clustering algorithm. To visualize how these groups are being formed, imagine an "X" being drawn in the center of mass of each cluster; also known as a centroid, this can be thought of as exerting a gravitational pull on nearby data points - those closer to that centroid will "belong" to that cluster, while other data points will be classified as belonging to the other clusters they are closer to.

This can be applied to FMRI data, where several different columns of data extracted from an ROI, representing different regressors, can be assigned to different categories. If, for example, we are looking for only two distinct clusters and we have several different regressors, then a voxel showing high values for half of the regressors but low values for the other regressors may be assigned to cluster 1, while a voxel showing the opposite pattern would be assigned to cluster 2. The label itself is arbitrary, and is interpreted by the researcher.

To do this in Matlab, all you need is a matrix with data values from your regressors extracted from an ROI (or the whole brain, if you want to expand your search). This is then fed into the kmeans function, which takes as arguments the matrix and the number of clusters you wish to partition it into; for example, kmeans(your_matrix, 3).

This will return a vector of numbers classifying a particular row (i.e., a voxel) as belonging to one of the specified clusters. This vector can then be prefixed to a matrix of the x-, y-, and z-coordinates of your search space, and then written into an image for visualizing the results.

There are a couple of scripts to help out with this: One, createBlankNIFTI.m, which will erase a standardized space image (I suggest a mask output by SPM at its second level) and replace every voxel with zeros, and the other script, createNIFTI.m, will fill in those voxels with your cluster numbers. You should see something like the following (here, I am visualizing it in the AFNI viewer, since it automatically colors in different numbers):

Sample k-means analysis with k=3 clusters.

The functions are pasted below, as well as a couple of explanatory videos.


function createBlankNIFTI(imageFile)

%Note: Make sure that the image is a copy, and retain the original

X = spm_read_vols(spm_vol(imageFile));
X(:,:,:) = 0;
spm_write_vol(spm_vol(imageFile), X);


=================================

function createNIFTI(imageFile, textFile)


hdr = spm_vol(imageFile);
img = spm_read_vols(hdr);

fid = fopen(textFile);
nrows = numel(cell2mat(textscan(fid,'%1c%*[^\n]')));
fclose(fid);

fid = 0;


for i = 1:nrows
    if fid == 0
        fid = fopen(textFile);
    end
    
    Z = fscanf(fid, '%g', 4);
    
    img(Z(2), Z(3), Z(4)) = Z(1);
    spm_write_vol(hdr, img);
end


Dissertation Defense Post-Mortem

A few weeks ago, I mentioned that I had my dissertation defense coming up; understandably, some of you are probably interested in how that went. I'll spare you the disgusting details, and come out and say that I passed, that I made revisions, submitted them about a week and a half ago, and participated in the graduation ceremony in full regalia, which I discarded afterward in the back of a U-Haul truck for immediate transportation to a delousing facility located somewhere on campus. Given that I was sweating like a skunk for nearly three hours (Indiana has quite a few graduates, it turns out), that's probably a wise choice.

For those who need proof that any of this happened, here's a photo:


I believe this conveys everything you need to know. Also, it costs considerably less than paying for the professional photos they took during graduation. Don't get me wrong; the ceremony itself was an incredible spectacle, complete with the ceremonial mace, tams and tassels and gowns of all fabrics and colors, and the president of the university wearing a gigantic medallion that makes even the most flamboyantly attired rapper look like a kindergartener. Even for all that, however, I don't believe it justifies photos at $50 a pop.

Currently I am in Los Angeles, after an extended stint in Vancouver Island visiting strange lands and people, touring the famous Butchart Gardens, and feeding already-overfed sea lions the size of airplane turbines. Then it's back to Minneapolis, Chicago, and finally Bloomington to pack up and leave for the East Coast.