Main Effects & Interactions: A Primer

I thought I'd blog outside today, to create a more informal setting. I was hoping we could talk a bit; you know, rap.

This week I taught my class about main effects and interactions - namely, how to eyeball a graph and determine whether there is a main effect, an interaction, or both. For those new to statistics or graphing results, there are a couple of mnemonics you can use to make an educated guess about which factors have a main effect, and if there is an interaction, what is driving it.

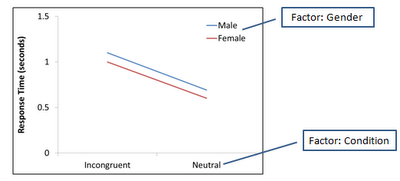
Example: Let's say we have a 2x2 factorial design. One factor is Gender with two levels: Male and Female. The other factor is Condition, also with two levels: Incongruent and Neutral. Gender is a between-subjects factor, since it is based on a population characteristic that is fixed (such as gender or handedness), while Condition is a within-subjects factor, since each participant is exposed to each level of that factor. We test them on a classic Stroop paradigm where they respond to the color of the word, not the word itself. We gather some data, average the reaction times for each combination of levels, and obtain the following results:


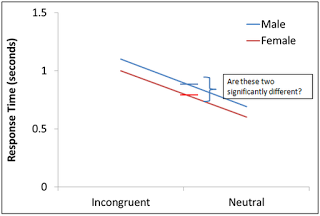
Overall, we can see that Females are faster, on average, than males - regardless of which condition they are in. In other words, there appears to be a main effect of Gender. (Note that in these examples no mention is given to standard error; however, for the moment, assume that the standard error is zero.) Another way to look at this is to determine whether the middle of the colored lines are significantly different from each other:


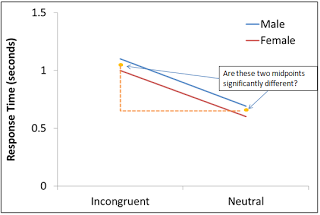
Likewise, can we ask whether there is a main effect of condition by looking at the average for the Incongruent condition, collapsed across levels of both Male and Female, to the average of the Neutral condition, collapsed across levels of both Male and Female. ("Collapsed" here simply means "Averaged"; in other words, what was the reaction time across all subjects for the Incongruent condition and the Neutral condition?) To look visualize this main effect in the graph, we can compare the averages of the endpoints of each line:


Now, let's ask whether there is an interaction: In other words, does reaction time depend on both the level of Condition and the level of Gender? In this case, the answer would be no; females are faster than males, regardless of which condition they are in. So if it doesn't depend on which condition they are in, there is no interaction.

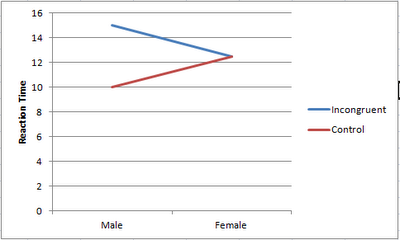
What does an interaction look like? Usually if the lines are crossed (or tending towards a crossing of each other) you can say that there is likely an interaction. (The calculation of an interaction is slightly more complicated than this, but for most purposes this assumption holds.) For example, let's modify the reaction times a bit and say that Females had the same reaction time regardless of which condition they were in, while Males were slower than Females in the Incongruent condition but faster in the Control condition:


In this case, there is no main effect of Gender; on average, Males and Females have the same reaction times. (Remember to look at the averages of the endpoints of the lines.) There does appear to be a main effect of condition, as the middle of the colored lines are different from each other. However, there is an interaction as well, as reaction time is dependent upon both the level of Gender and the level of Condition. In other words, if someone asked you whether Males had different reaction times than Females for a stroop task, you would say that it depends on which condition they are in.

This same rationale can be applied to main effects and interactions for beta weights extracted from FMRI data; simply replace reaction time with beta weights for the dependent variable, and the interpretations are the same.


When Stuff Goes Wrong

One complaint I have with FMRI tutorials and manuals is this: The user is provided a downloadable dataset and given a tutorial to generate a specific result. There is some commentary about different aspects of the analysis pipeline, and there might be a nod to artifacts that show up in the data. But for the most part things are expected to be more or less uneventful, and if anything goes wrong during the tutorial, it is likely because your fat fingers made a typo somewhere. God, you are fat.

Another thing: When you first read theory textbooks about fMRI data analysis, a few boogie men are mentioned, such as head motion or experimental design confounds. However, nothing is mentioned about technicians or RAs screwing stuff up, or (more likely) you yourself screwing stuff up. Not because you are fat, necessarily, but it doesn't help.

Bottom line: Nobody tells you how to respond when stuff goes wrong - really wrong - which it inevitably will.

No, I'm not talking about waking up feeling violated next to your frat brother; I'm talking about the millions of tiny things that can derail data acquisition or data analysis or both. This can end up costing your lab and the American taxpayer literally thousands - that's thousands, with a "T" - of dollars. No wonder the Tea Party is pissed off. And while you were hoping to get that result showing that conservatives/liberals exhibit abnormal neural patterns when shown pictures of African-Americans, and are therefore bigoted/condescending scum that deserve mandatory neural resocialization, instead you end up with a statistical map of blobs that looks like the frenetic finger-painting of a toddler tripping balls from Nutella overdose. How could this happen? Might as well go ahead and dump all seventy activation clusters in a table somewhere in the supplementary material where it will never see the light of day, and argue that the neural mechanisms of prejudice arise from the unfortunate fact that the entire brain is, indeed, active. (If this happens, just use the anodyne phrase "frontal-parietal-temporal-occipital network" to describe results like these. It works - no lie.)

How to deal with this? The best approach, as you learned in your middle school health class, is prevention. (Or abstinence. But let's get real, kids these days are going to analyze FMRI data whether we like it or not, the little minks.) Here are some prophylactic measures you can take to ensure that you do not get scalded by unprotected data analysis:

1) Plan your experiment. This seems intuitive, but you would be surprised how many imaging experiments get rushed out the door without a healthy dose of deliberative planning. This is because of the following reasons:
  1. You will probably get something no matter what you do.
  2. See reason #1
2) Run a behavioral pilot. Unless the neural mechanism or process is entirely cognitive and therefore has no behavioral correlate (e.g., instructing the subject to fantasize about Nutella), try to obtain a performance measure of your conditions, such as reaction time. Doing this will also reinforce the previous point, which is to plan out your experiment. For example, the difference in reaction time between conditions can provide an estimate of how many trials you may need during your scanning session, and also lead to stronger hypotheses about what regions might be driving this effect.

3) Have a processing stream already in place before the data starts rolling in. After running your first pilot subject, have a script that extracts the data and puts everything in a neat, orderly file hierarchy. For example, create separate directories for your timing data and for your raw imaging data.

4) As part of your processing stream, use clear, understandable labels for each new analysis that you do. Suffixes such as "Last", "Final", "Really_The_Last_One", and "Goodbye_Cruel_World", although optimistic, can obscure what analysis was done when, and for what reason. This will protect you from disorganization, the bane of any scanning experiment.

5) Analyze the hell out of your pilot scan. Be like psychopath federal agent Jack Bauer and relentlessly interrogate your subject. Was anything unclear? What did they think about the study, besides the fact that it was so boring and uncomfortable that instead of doing it again they would rather have a vasectomy with a weed-whipper? You may believe your study is the bomb, but unless the subject can actually do it, your study is about as useful as a grocery bag full of armpit hair.

6) Buy a new printer. Chicks dig guys with printers, especially printers that print photos.

Your ticket to paradise

7) Check the results of each step of your processing stream. After you've had some experience looking at brain images, you should have an intuition about what looks reasonable and what looks suspect. Knowing which step failed is critical for troubleshooting.

8) Know how to ask questions on the message boards. AFNI, SPM, and FSL all have excellent message boards and listservs that will quickly answer your questions. However, you should make your question clear, concise, and provide enough detail about everything you did until your analysis went catastrophically wrong. Moderators get pissed when questions are vague, whiny, or unclear.

9) When all else fails, blame the technicians. FMRI has been around for a while now, but the magnets are still extremely large and unwieldy, cost millions to build and maintain, and we still can't get around the temporal resolution-spatial resolution tradeoff. Clearly, the physicists have failed us.


These are just a few pointers to help you address some of the difficulties and problems that waylay you at every turn. Obviously there are other dragons to slay once you have collected a good sample size and need to plan your interpretation and possible follow-up analysis. However, devoting time to planning your experiment and running appropriate behavioral studies can go a long way toward mitigating the suffering and darkness that follows upon our unhappy trade.

Mine's Bigger: Connectivity Analysis Uses Sample Size of 439 Subjects


The next time you look at your dwindling scanning budget and realize you need to start coming in at 9:00pm on Fridays to pay a reduced scanning rate, just remember that there are other researchers out there who scan hundreds of subjects for a single study. (This isn't supposed to make you feel better; it's just a fact.)

A recent connectivity analysis by Dennis and colleagues recruited four hundred and thirty-nine subjects for a cross-sectional study to determine changes in connectivity from the ages of twelve to thirty. Overall, older participants showed decreasing long-range connectivity between regions, increased modularity (a measure of subdivision within regions), and hemispheric differences in global efficiency, consistent with developmental theories that short-range connections are pruned during adolescence while long-range connections are strengthened.

However, the observed hemispheric differences in global efficiency contrasted with previous findings:
Our results are contrary to those of Iturria-Medina et al. (2011), who found greater global efficiency in the right hemisphere, but these were from a relatively small sample of 11 subjects, and our sample is over 40 times larger. [Emphasis added.]

Boom. Over forty times larger, son. Sit the hell down. "But forty times eleven is four hundred forty." Yeah, well, the jury's still out on mathematics. "But we ran a well-controlled study!" WHAT PART OF FORTY TIMES LARGER DON'T YOU UNDERSTAND?!

Proof that size equals power can be found here.

FSL Tutorial 8: FAST

For countless aeons did neuroscientists burn with the perverse desire to segment human brains apart in vivo, while the juicy glands still pulsated with life within their unfortunate hosts. Numerous methods were attempted, as crude as they were unnatural - paint scrapers, lint rollers, zesters - but without success. And the neuroscientists did curse and they did rage and they did utter blasphemy of such wickedness as to make the ears of Satan himself bleed. With the terrible advent of FMRI did that all change; now, the tissue of the brain, the seat of consciousness, could be blasted apart while leaving its host intact; now could the grey be separated from the white, the gold from the dross. And then did the neuroscientists go down and slay the Canaanites, thirty thousand in number, and not a man survived as the neuroscientists did wade through swales of blood covered with the skins of their enemies and their eyes burned centroids of murder.

So goes the story of the creation of FAST. The tool is straightforward: Provide a skullstripped brain, decide how many tissue classes you wish to segment, and the rest of the defaults are usually fine. Often a researcher will want three tissue classes: White matter, grey matter, and cerebrospinal fluid (CSF). However, if you are dealing with a subject that presents with a brain abnormality, such as a lesion, you may want to increase the number of classes to four in order to segment the lesion into its own class.

FAST outputs a dataset for each tissue type. For example, if three tissue types have been segmented, there will be three output datasets, one corresponding to each tissue class; each dataset is a mask for each tissue type, and contains a fraction estimate at each voxel. The picture below shows a grey matter mask segmented with FAST. The intensity at the voxel centered at the crosshairs is 0.42, meaning that 42% of that voxel is estimated to be grey matter; presumably, the other 58% is white matter, as the voxel lies at the boundary between the head of the caudate nucleus (a grey matter structure), and the internal capsule (which is composed of white matter).


For some packages such as SPM, tissue masks can be used for normalization. For example, the grey matter and white matter masks will be normalized to mask templates in a standard space, such as MNI, and these warping parameters are then applied to the functional runs. However, the volume of these masks can also be calculated and compared across subjects or across groups. In order to calculate the total grey matter volume within a mask, for example, fslstats can be used:

fslstats s007a1001_brain_pve_1.nii.gz -M -V | awk '{ print $1 * $3 }'

This will return the volume of the mask in cubic millimeters; the same operation can be applied to the other masks by substituting s007a1001_brain_pve_1 with a different class (e.g., either 0 or 2).

However, for more sophisticated voxel-based morphometry comparing volumetric differences between focal cortical areas or specific subcortical structures, I recommend FreeSurfer. Brain segmentation is part of the default processing stream in FreeSurfer, and the volume of each area is output into a formatted table. This will be covered in a later tutorial; for now, use FAST and appreciate its bloody, violent history.

FSL 5.0 Released

I don't know how I missed this, but last month a major version of FSL was released: 5.0. This means that:
  1. Everything I had previously written about FSL is now obsolete, and you were a fool to read it; and
  2. There have also been changes to processing anatomical datasets, field maps, and independent component analysis, which look interesting. Interesting, as in, I don't completely understand all the changes they made, but they look impressive.
I haven't had much time to sink my paws into it, but it looks similar to FSL 4.x. More details to come.

Milwaukee Marathon Postmortem

I arose just before six, the wind outside a mere whisper and the lake below black as jet and the wretched sun yet to raise its head above the horizon. I ate; I drank; I slapped my muscles until I felt a pleasant numbness and then I sat at the edge of the bed and breathed deeply, taking in great lungfuls of that charged air until it radiated to my fingertips. Then did I stand at the window and witness the slow birth of a new day, the sun crowning just above the east and scattering upon the face of the water an afterbirth of pale yellows and pinks.

The mercury registered at just above freezing. I threw on layers of wool and synthetics; drew my gloves tight until that slight pull at the ends of the fingers; threaded the aglets through the timing chip with meticulous care; delicately placed a bandage on each of the girls. Double, triple-check to make sure the bib number is still pinned to your singlet, and then it's out the door and to the starting line.

The details of the race are here omitted; all I can say is that I was greedy. Greedy for a personal best, greedy for prize money, greedy for the win. As the starting gun went off I saw that I might have a chance at taking it - race, player, life, all - and the cisterns of my bloodlust quivered with excitement and my fury slipped its leash. Like a fool did I run, swaying to the shouts and the yells and the whims and the vicissitudes of the mob, which would later come crashing down upon my head. The turning point came just after mile twenty, when I had to briefly stop and I was filled with the violent urge to vomit; thereafter was my mouth a foul mixture of acid and adrenaline, from which I never recovered. 

Months I had spent dreaming of that last steep descent into Veterans Park, the glittering whitecaps of Lake Michigan in the distance and the sanguinary roar of the crowd as I hurtled the broken bodies of my dying enemies and rushed toward glorious victory. Instead, it was a death march. My overweening pride, transformed into abject humiliation; my obsession with glory, turned into a singleminded focus on controlling my bowels; and each step down that lonely road cracked the tarsals of my feet and tore at the ligaments of my knees. In my mind the encouraging shouts of the crowd had turned into jeers, and I expected mire and excrement to be thrown upon my face. A sorry sight was I, staggering across the finish line, exhausted, limping to the side of that great body of water and searching for the glorious, glittering whitecaps of my dreams; but the sky was as a great grey blanket thrown over the roof of the world and I stood there in terrible silence as the heat of life evaporated and the chill wind cut to the bone.

Visions Fugitives

Pile of buffalo skulls, ca. 1880's.

Your ideas are terrifying and your hearts are faint. Your acts of pity and cruelty are absurd, committed with no calm, as if they were irresistible. Finally, you fear blood more and more. Blood and time.
 -Paul ValĂ©ry

It came to me in a series of dreams: The race; a great battle upon the vastation; the infuriate sun gazing upon the carnage.

I sat immobile as upon a throne enshrouded in darkness. And the gates before me opened up as the maw of some great beast and my eyes burned with the terrible vision and my heart was drunk with horror.

And I beheld a horde of men innumerable: wild-eyed, mouths besprent with froth, faces twisted into masks of agony. Blind, stupid animals. They swarm forward, mindless as ants; they sing hymns of blood and death.

It is whittled down to the few. One stumbles and falls; he crawls upon the ground like a dog, begging for mercy. A loud crack, and double fistfuls of gore vomit from his temple. Bad luck. Another simply stops; he stands there, blinking stupidly. A pair of hands emerge and one hand holds a razor wrapped in silk and his throat is cut like a sheep, carmine fountains of life erupting from his veins. And yet one more halts of his own volition and stands his ground with great shouts of defiance and the figures swarm forward and he is mobbed and he is sodomized and he is slain to the sound of laughter as loud as screams.

The gates closed and again was I engulfed in darkness. And as I traveled through universes of pain and suffering, I beheld a great void: And there I sat, as immobile as the three-faced beast in the lake of ice, and my limbs were paralyzed in fear; and the demon by my side knelt down and whispered atrocities unto my ear, the vision of which is recorded herewith.

Underneath the westering sun was there a great slaughter and the funeral pyres burned with unslakeable thirst and did choke the sky with their foul discharge, and the wolves and the buzzards and the feeders of carrion went half-crazed from the stench of decay. And the reivers roamed the vastation, wretched trains of concubines and catamites in their wake, their alien forms oversized with coagulate gore, gimlet-eyed, irresistible as death as their magnetic pull guides them to the last few broken hovels upon the wasteland and the air is filled with the whine of flies and the cacophony of screams. And all was beheld and burned to ashes underneath the pandemonium of the dying sun.

FMRI Motion Correction: AFNI's 3dvolreg

I. Introduction

The fortress of FMRI is constantly beseiged by enemies. Noisy data lead to difficulties in sifting the gold of signal from the flotsam of noise; ridiculous assumptions are made about blood flow patterns and how they relate to underlying neural activity; and signal is corrupted by motions of the head, whether due to agitation, the sudden and violent ejection of wind, or the attempt to free oneself from such a hideous, noisy, and unnatural environment.

This last besetting weakness is the root of much pain and suffering for neuroimagers. Consider that images are acquired on the order of seconds and strung together as a series of snapshots over a period of minutes. Consider also that we deal with puny, squirmy, weak-willed humans, unable to remain still as death for any duration. Finally, consider that head motion may occur at any time during the acquisition of our images - as though we were using a slow shutter speed to take a picture of a moving target.

Coregistration - the spatial alignment of images - attempts to correct these problems. (Note that the term coregistration encompasses both registration across modalities, such as T2-weighted images to a T1-weighted anatomical, and registration within a single modality. The latter is often referred to as motion correction.) For example, given a time series of T2-weighted images, coregistration will attempt to align all of those images to a reference image. This reference image can be any one of the individual functional images in the time series, although using the functional image acquired closest in time to the anatomical image can lead to better initial alignment. Once a reference image has been chosen, spatial deviations are then calculated between the reference image and all other functional images in the timeseries, each image shifted by the inverse of these calculated distances from the reference image.


II. Rigid-body transformations

It what ways can images deviate from each other? Often we assume that images taken from the same subject can be realigned using rigid-body transformations. This means that the size and shape of the registered images are the same, and only differ in translations along the x, y, and z axes, and in three rotation angles (roll, pitch, and yaw). Each of these can be shown by a simple example. First, locate your head and prepare to move it. Ready?
  1. Fix your vacant stare upon an attractive person in front of you. This can be someone in either a classroom or a workplace setting. While you stare, keep your body still and only move your head to the left and right. This is moving along the x-axis.
  2. While the rest of your body remains immobile, again move your head - this time, directly forward and directly backward. This is moving along the y-axis.
  3. Keep staring. Now extend your neck directly upward, and compress it as you come downward. This is moving along the z-axis.
  4. Are you feeling that telluric connection with her yet? Perhaps these next few moves will get her to notice you. Nod your head vigorously back and forth in a "Yes" motion. This is called the pitch rotation, and will entice her to approach you.
  5. Now, send mixed signals by shaking your head "No". This is called the yaw rotation, and will both confuse her and heighten the sexual tension.
  6. Finally, do something completely different and roll your head to the side as though touching your ears to your shoulders. This is called the roll rotation, and will make her think you either have a rare movement disorder or are batshit insane. Now you are irresistible.
The correct execution of these moves can be found in the following video.


III. 3dvolreg

3dvolreg, the AFNI command to perform motion correction, will estimate spatial deviations between the reference functional image and other functional images using each of the above movement parameters. The deviation for each image is calculated and output into a movement file which can then be used to censor (i.e., remove from the model) timepoints that contain too much motion.

A typical 3dvolreg command requires the following arguments:

  • base (sub-brik): Use this sub-brik of the functional dataset as the reference volume.
  • zpad (n): Pad each volume with n voxels with a value of zero prior to motion correction, then remove them afterward.
  • (Interpolation method): Can be cubic, linear, or heptic; in general, higher-order interpolations are slower but produce better results.
  • (prefix): Label for output dataset.
  • -1Dfile (label): Label for text file containing motion estimates for each volume.
  • -1Dmatrix_save (label): Label for text file containing matrix transformations from each volume to reference volume. Can be used later with 3dAllineate to warp each functional volume to a standard space.
  • (input): Functional volume to be motion-corrected.

Assume that we have already slice-time corrected a dataset, named r01.tshift+orig. Example command for motion correction:
3dvolreg -verbose -zpad 1 -base r01.tshift+orig'[164]' -heptic -prefix r01_MC -1Dfile r01_motion.1D -1Dmatrix_save mat.r01.1D r01.tshift+orig

After you have run motion correction, view the results in the AFNI GUI. (It is helpful to open up two windows, one with the motion-corrected data and one with the non-corrected data.) By selecting the same voxel in each window, note that the values are different. As the motion-corrected data is now slightly shifted and not in the location that was originally sampled, your chosen spatial interpolation method will estimate the intensity at each new voxel by sampling nearby voxels. Lower-order interpolation methods are usually a weighted average over the intensity of immediately neighboring voxels, while higher-order interpolations will use information from a wider range of nearby voxels. Assuming you have a relatively new machine running AFNI, 3dvolreg is wicked fast, so heptic or fourier interpolation is recommended.

Last, AFNI's 1dplot can graph the movement parameters dumped into the .1D files. A special option passed to 1dplot, the -volreg option, will label each column in the .1D file with the appropriate movement label.

Example command:
1dplot -volreg -sepscl r01_motion.1D

IV. Potential Issues

Most realignment programs, including 3dvolreg, use an iterative process: small translations and rotations along the x-, y-, and z-axes are made until a minimum in the cost function is found. However, there is always the danger that this is a local minimum, not a global minimum. In other words, 3dvolreg may think it has done a good job in overlaying one image on top of the other, but a larger movement may have led to an even better fit. As always, look at your data both before and after registration to assess the goodness of fit.

Also note that motions that occur on the scale of less than a TR (e.g., less than 2-3 seconds) cannot be corrected by 3dvolreg, as it assumes that any rigid-body motion occurs across volumes. There are more sophisticated techniques which try to address this, with varying levels of success. For now, accept that your motion correction will never be perfect.


Prokofiev: Etude and Piano Concerto

Sergei Prokofiev (1891-1953)


Mention the name of Prokofiev to any musician, and instantly a mental curtain goes up: They hear music of caprice, vigor, and daring; original almost to the point of eccentricity; Russian in the fullest sense of the word.

"I abhor imitation," Prokofiev once wrote, "and I abhor the familiar." Certainly, Prokofiev is a difficult man to pin down; some categorize his music as neo-classical, others as sui generis. By pushing the limits of public taste, he invited both admiration and scathing criticism; however, nearly sixty years after his death, his seat among the pantheon of musical gods remains secure.

The following two selections provide a glimpse into Prokofiev's world. Doubtless, they represent only an incomplete part of him. Both his etudes, op. 2, and his piano concerto no. 1, op. 10, were composed at the beginning of his career; they are worlds removed from the dark, sarcastic, acidic hatred of his final piano sonatas or his colossal, finger-breaking Sinfonia Concertante. (Truly, both Shostakovich and Prokofiev, their souls hardened and warped within the crucible of Stalinist Russia, are two of the greatest gifts to be produced by that unhappy era.)

However, these pieces are a good point of entry into Prokofiev's beautiful imagination. The etudes and piano concerto are energetic, bombastic, unabashedly virtuosic pieces Prokofiev used as vehicles to coruscate onto the musical scene as a singular composer-pianist. And while Prokofiev used the piano to incredible effect, mind that it represents only a fraction of his music output - an oeurve which comprised operas, symphonies, ballets, and a superb cello sonata. The inquisitive listener will be drawn to seek out these gems.

For now, enjoy the dark sonorities and virtuosic daring of his etude in D minor, a picture of the brashness and audacity of a young man beginning to realize his powers; enjoy the roller-coaster ride of the piano concerto finale, a movement traversing an astonishing range of gorgeous, transcendental, sometimes bizarre emotions, climaxing with endless cascades of octaves over the glorious swells of the orchestra.


Bootstrapping

As I am covering bootstrapping and resampling in one of my lab sections right now, I felt I should share a delicious little applet that we have been using. (Doesn't that word just sound delicious? As though you could take a juicy bite into it. Try it!)

I admit that, before teaching this, I had little idea of what bootstrapping was. It seemed a recondite term only used by statistical nerds and computational modelers; and whenever it was mentioned in my presence, I merely nodded and hoped nobody else noticed my burning shame - while in my most private moments I would curse the name of bootstrapping, and shed tears of blood.

However, while I find that the concept of bootstrapping still surpasses all understanding, I now have a faint idea of what it does. And as it has rescued me from the abyss of ignorance and impotent fury, so shall this applet show you the way.

Bootstrapping is a resampling technique that can be used when there are few or no parametric assumptions  - such as a normal distribution of the population - or when the sample size is relatively small. (The size of your sample is to be neither a source of pride nor shame. If you have been endowed with a large sample, do not go waving it in the faces of others; likewise, should your sample be small and puny, do not hide it under a bushel.) Say that we have a sample of eight subjects, and we wish to generalize these results to a larger population. Resampling allows us to use any of those subjects in a new sample by randomly sampling with replacement; in other words we can sample one of our subjects more than once. If we assume that each original subject was randomly sampled from the population, then each subject can be used as a surrogate for another subject in the population - as if we had randomly sampled again.

After doing this resampling with replacement thousands or tens of thousands of times, we can then calculate the mean across all of those samples, plot them, and see whether 95% of the resampled means contains or excludes zero - in other words, whether our observed mean is statistically significant or not. (Here I realize that, as we are not calculating a critical value, the usual meaning of a p-value or 95% confidence interval is not entirely accurate; however, for the moment just try to sweep this minor annoyance under the rug. There, all better.)

The applet can be downloaded here. I have also made a brief tutorial about how to use the applet; if you ever happen to teach this in your own class, just tell the students that if the blue thing is in the gray thing, then your result fails to reach significance; likewise, if the blue thing is outside of the gray thing, then your result is significant, and should be celebrated with a continuous bacchanalia.